Design Systems
This practical data design ecosystem provides you with reusable data design components, developed to complement your existing design language. This practical ecosystem provides you with a big box of reusable data design components, assembled for teams to be guided by documentation and develop iteratively.
Key benefits
01
Suite of individual data-led design Assets and Elements, adding efficiency and consistency to existing design processes
02
Provides a best-practice benchmark for branded data-led assets across static, animated and interactive formats
03
Breathes new life into your existing asset library, providing clear creative guidelines for diagrammatic, map and chart-related needs.

Moody’s | Data Design Guidelines
Case studyLet's talk
Get in TouchFAQ
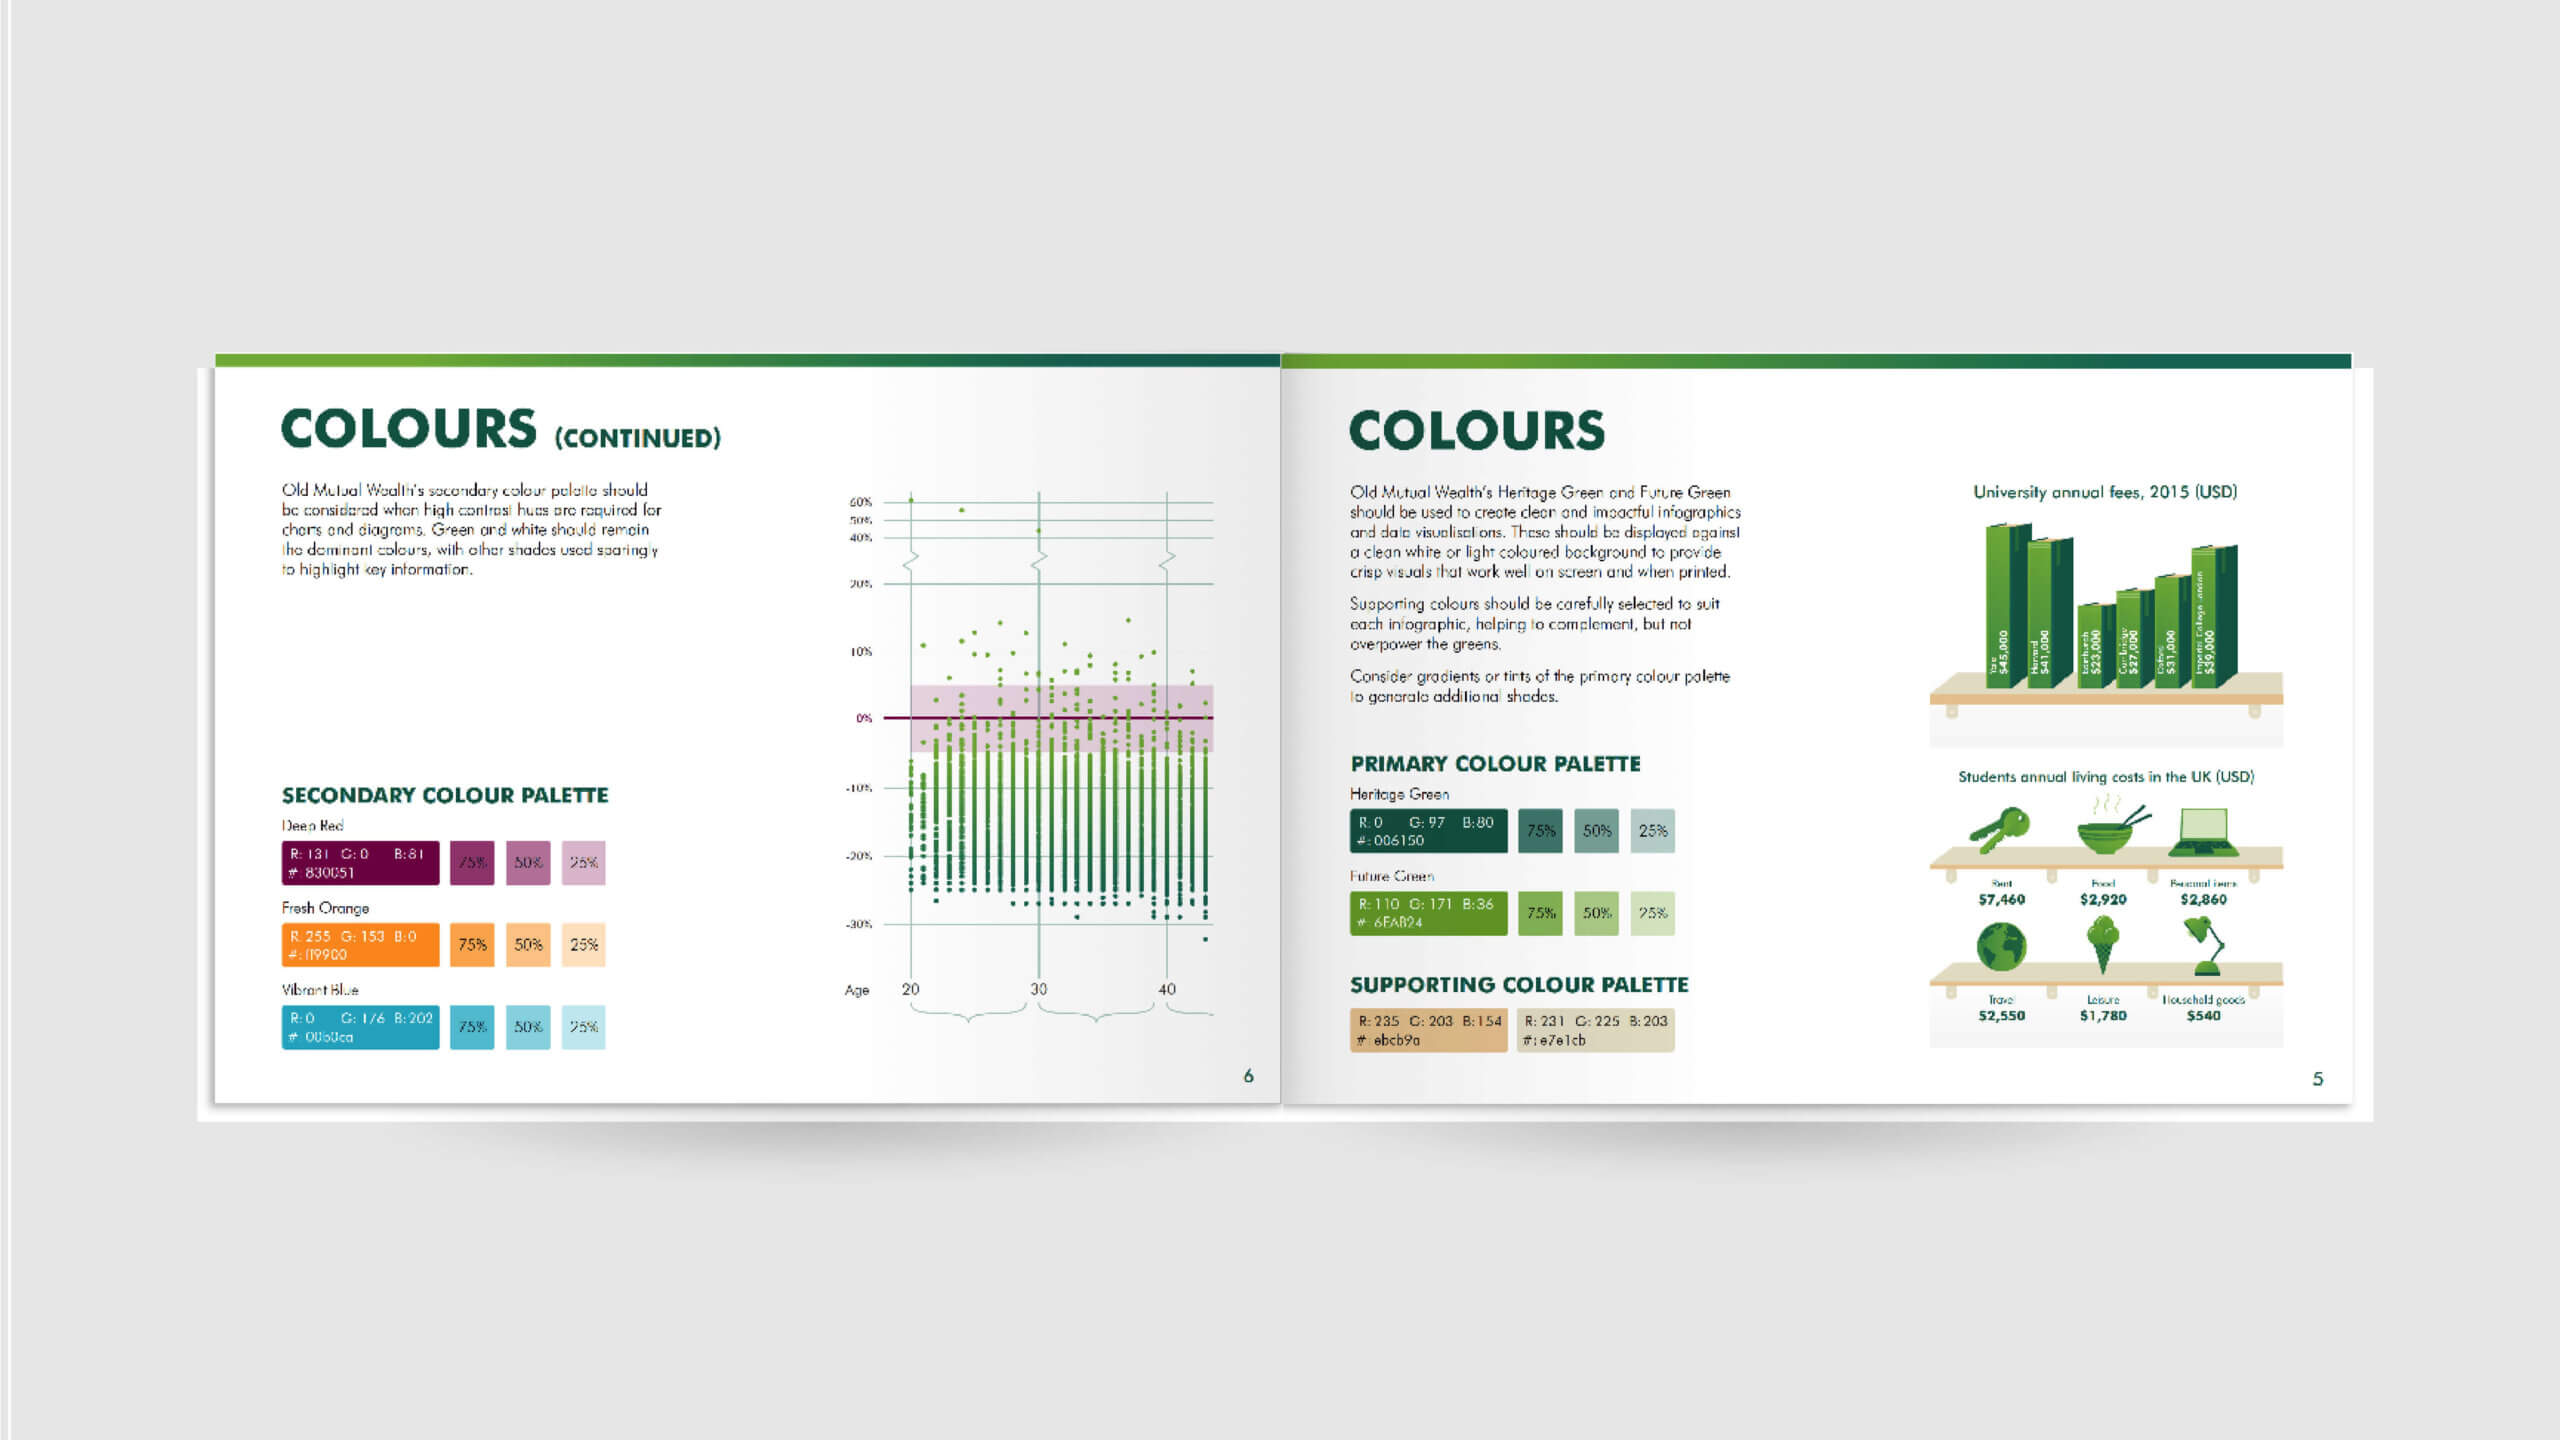
A data visualisation style guide provides standards on how to format charts, infographics, and related diagrams. Here is a helpful resource all about data visualisation guides.
No they are not. Brand guidelines determine how a brand presents itself through colour, typography, layout, and other visual elements. A data design system exists within brand guidelines and determines how data is visually represented.