Data For everyone is one of our core agency pillars. We use data in a variety of ways for a variety of brands: to shape a story, validate or define a strategy, and measure results. We’re inspired by work that uses data to delight, inspire, challenge and educate. And we hope to bring a small snapshot of this work with each new edition of Data for Everyone.
This edition focuses on using data as a different lens through which we can understand an issue deeper. The use of this technique is used across a wide range of subjects, from the guilty pleasure of obsessing over Love Island couples to confronting the gender gap in UK’s parliament. But regardless of the topic, the question is the same: instead of anecdotal evidence, what does the data have to say?
Read on to see how content producers are taking a different approach to storytelling, taking aim at well-known narratives using the data behind them.
Brandwatch analysis to predict Love Island winners
Objective
- Raise awareness of the power of the Brandwatch platform through applying its use to a trending TV show with widespread viewership
Approach
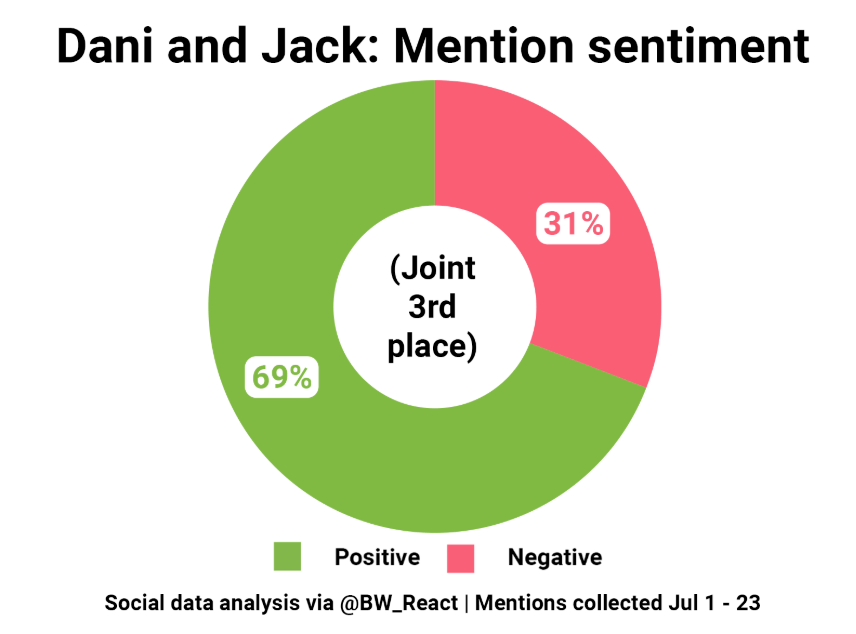
Social data journalist Gemma Joyce published a blog post which analysed tweets about Love Island in order to predict the winners for the finale episode. Using the Brandwatch analytics and social listening platform, she gathered insights on most used emojis on social media in relation to the couples on the show. Based on the overall positive sentiment and emojis attached to Dani and Jack, Gemma predicted that the couple would take home first prize—and she was right!
Why it worked
Loads of people watch Love Island in the UK. In fact, this year saw a record breaking number of viewers for it’s finale with over 4 million people tuning in. The Brandwatch blog works first and foremost because it’s relevant and of-the-moment. The use of emojis throughout the analysis also feels fun, light-hearted and social.
But most importantly, the short blog shows off the power of Brandwatch’s flagship product in a use case that appeals to lots of brands. It reveals the power and ease of discovering timely data, harvesting audience sentiment, and then using that data to accurately predict a future outcome. Sure, the stakes weren’t all that high considering it was Love Island; but it’s not a far leap to see how a tool like Brandwatch could also be invaluable to businesses looking for deeper audience insight online.
Women in Parliament
Objective
- To educate and engage readers with the history of women in parliament, and to use data as a way of authoritatively highlighting the gap between women and men in government.
Approach
Advocacy organisation 50:50 Parliament partnered with visual essay magazine The Pudding to create an interactive scrollable story of the gender divide in parliament. Story author Durand D’souza pulled multiple datasets together to create a widespread, historical analysis of the progress (and work still to be done) regarding female representation in politics.
He used machine learning packages to detect trends and anomalies in the data that revealed interesting patterns in speech transcripts and other open datasets. The use of “scrollytelling”, or highlighting animated, interactive charts throughout the story, helps to walk the reader through what might otherwise be complex and inaccessible data.
Why it worked
Although it’s an issue most people will be aware of, this piece brings the impact of gender representation to a new level by visualising the dramatic difference between men and women in parliament. The story strikes a nice balance between showing the progress that has been made, and the work that still needs to be done to create 50/50 representation in UK parliament.
This method of storytelling with data works especially well by catering to multiple types of users. Some people will want to simply scroll through, and only look at the highlights of each chart. But for the “data divers”, each chart is interactive and can be explored further by hovering or typing a search term into the bar at the top of each graph.
Do Nike shoes make you run faster?
Spoiler alert: they actually do! According to the data
Objective
- Challenge Nike’s claim that their shoes make people run faster with hard facts and numbers from US marathon runners
Approach
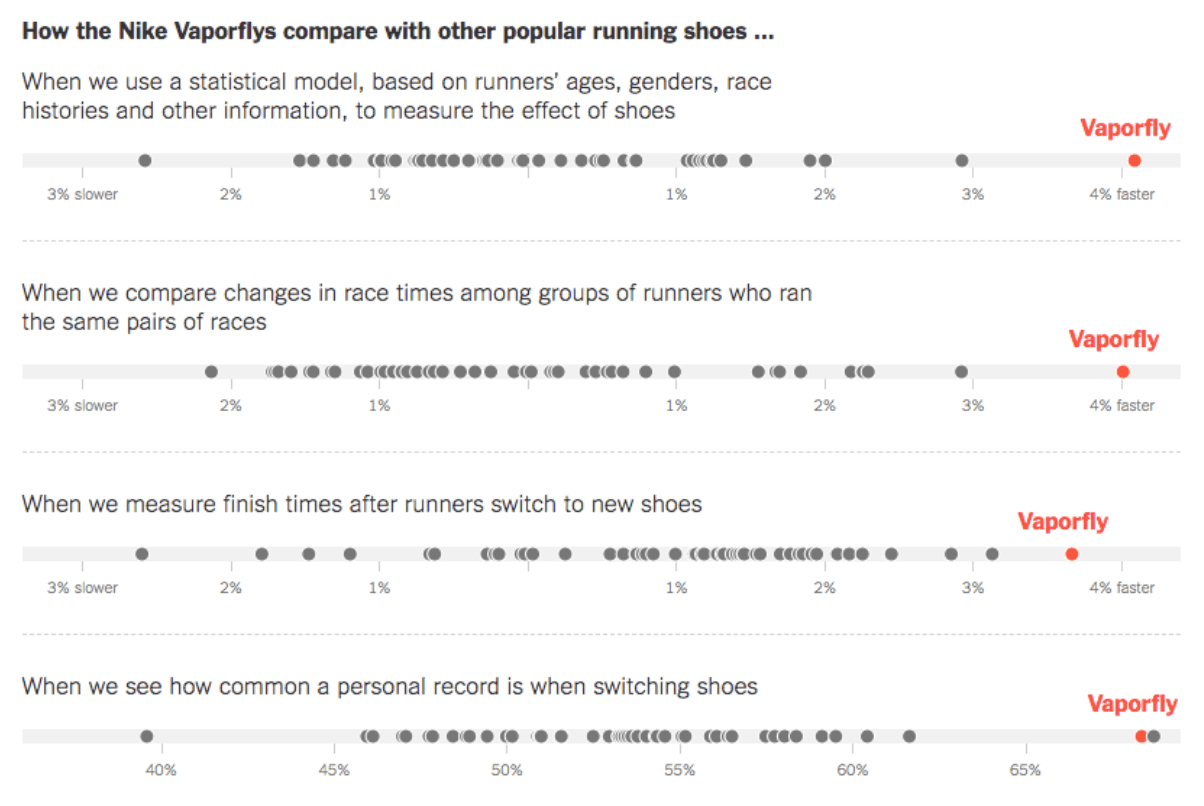
The New York Times decided to hold Nike to account by testing their claims of elevated performance (which brands tend to exaggerate) against real race performance. Fortunately for Nike, race times from runners wearing Nike Vaporflys appear to consistently outperform runners with other shoes (by 3 to 4 percent faster on average in fact). The use of editorial annotations on charts throughout the piece guide the user through the most compelling evidence in favor of Nike’s newest, elite line of running trainers.
Why it worked
This is a perfect example of testing anecdotal evidence against data. Brands often slap a pair of trainers on a famous athlete in hopes of people associating elevated performance with the shoes. The NYT takes a different approach, by looking at the numbers and educating readers on what the data actually is saying about the Vaporflys.
The NYT analysis works because it is driven by curiosity. It’s a question that has surely passed through many minds: does the shoe really make you faster? While not always perfect, data gives us the best chance at answering this kind of question. And even better yet, diving into the data isn’t necessarily an exclusive activity. Writers at the NYT used public data and race reports from fitness app Strava, open to anyone, waiting to be used in new and exciting ways.
Remote workers data analysis
Beautiful charts and a very relevant topic: are remote workers more productive/efficient with their time?
Objective
- To examine the widely discussed topic of remote working through the lense of data, interrogating claims about it’s benefits and downfalls
Approach
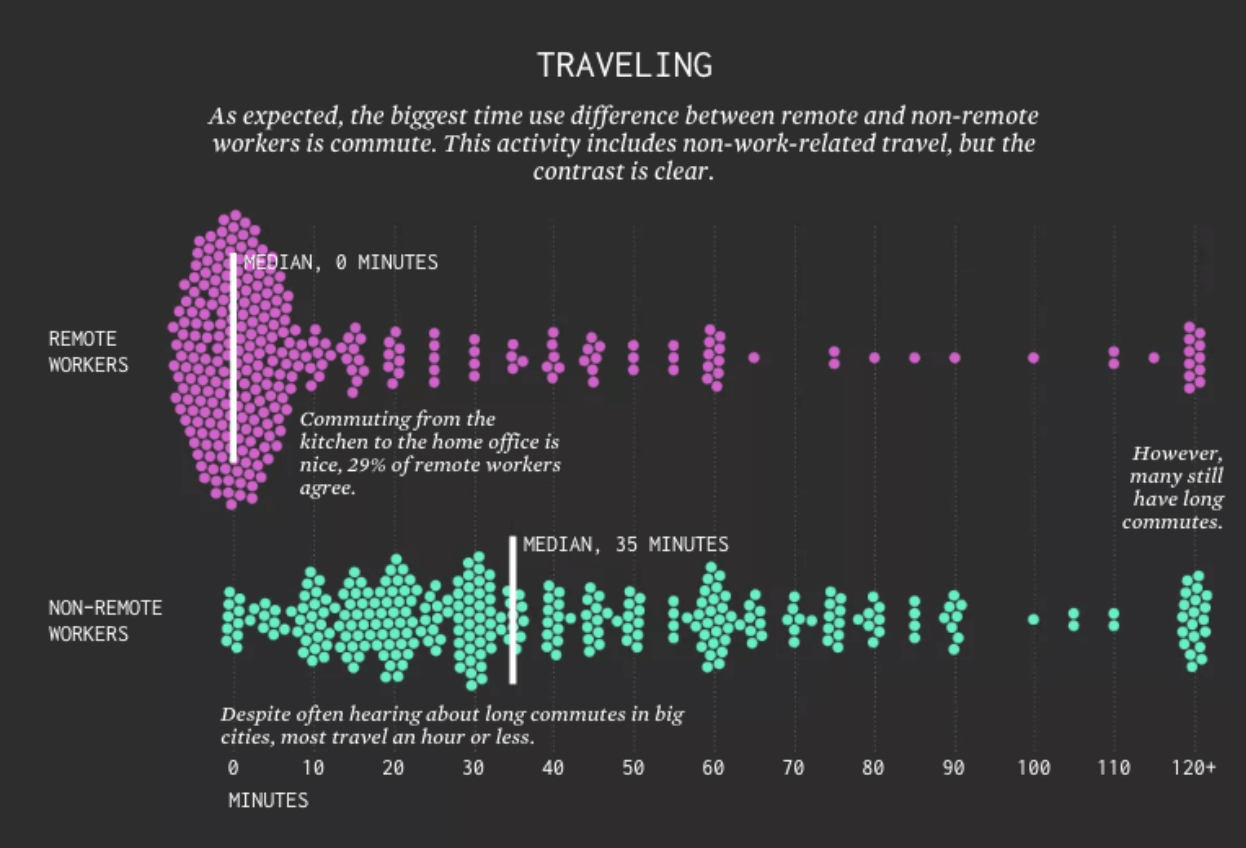
Data visualisation expert Nathan Yau has created a name for himself through his fascinating, deep dives into the data behind everyday issues. His latest piece looks at the issue of remote workers through the frame of a series of questions: do they save time on traveling? Do they work longer hours? Are they more efficient overall? Through a series of eye-catching charts and detailed annotations, he opens up data from the American Time Use Survey to bring a new perspective to the remote working debate.
Why it worked
Remote working is a hot topic in the media, and now more frequently requested by younger professionals. In 2016, Trades Union Congress released a study which showed that remote work has risen by over 19% in the past decade. It’s merits are debated by employers depending on the industry, but Yau takes a different approach by looking at the numbers behind the issue. His editorial annotations help to guide users who may not be as comfortable with charts through the most important takeaways of his analysis.
At infogr8 we strive to open up the world of truly data-driven content to brands and marketeers. When used correctly, data can be a powerful tool that helps communicate, engage and inform audiences. The first step in this journey is curiosity and an openness to what you might discover. Then it’s about telling the story through this new lens of data, a frame that can offer credibility, authority and a new level of insight that hearsay never will.
Interested in telling stories with data?