How we’re mapping local authority progress towards net zero targets to create an engaging, action-oriented benchmark for climate action
As part of our FutureFridays innovation lab, and based on our work with the City of London Corporation, we wanted to focus on the climate action challenge for UK local authorities.
At the beginning of 2022, more than 20% of all councils in the UK had no climate action plan. Yes, local authorities face many challenges (especially budgetary ones), but they are also a key player between government policy and the public in driving action towards net zero.
When researching other net zero benchmarking tools and league tables, we felt that many were still clunky, complex and unappealing to users. We wanted to create an inviting user experience – featuring best-in-class data visualisation – to ensure a wide range of audiences could understand the data and encourage them to interact with the content. We were keen to start a conversation and show the value of data visualisation to inspire climate discussion, decision-making and action.
For the project, we partnered with dedlyne, founded in 2020 to create greater awareness, engagement and action behind the UN SDGs by determining the date when businesses are set to attain them. We wanted to support dedlyne in creating a data tool to effectively visualise the net zero progress data from over 300 local authorities in an engaging and simple way.
“When an organisation reports carbon reductions of 15% or 20,000 tonnes it sounds great, but what does it really mean? Using trend data and projecting attainment dates of Net Zero in a visual format allows a far better framing of current performance, our progress meeting targets, and the behaviour required to accelerate action.”
– Huw Bunn, Co-Founder, dedlyne
Building an MVP for net zero tracking
In January 2023, as part of our FutureFridays initiative, we decided to tackle the problem of the inconsistent, complex and visually dense reporting on progress towards net zero targets in UK local authorities.
We wanted to explore how best-practice data visualisation could help to better raise awareness and drive action, as well as team up with our partners at dedlyne to show the data in a more intuitive and practical way – a date when local authorities are on track towards attaining net zero.
We pulled together a dedicated team from our Sustainability pod and data specialists from our distributed network:
 |
 |
 |
| Stewart Pickering GM Sustainability |
Josephine Brown Strategist |
David Bumbeishvili Data Developer |
 |
 |
 |
|
Razvan Zamfira |
Valerio Pellegrini |
Mariam Tsutskiridze |
Working with dedlyne, we created an interactive data tool mapping local authority performance on net zero, broken down by sectors. The tool was custom-coded, which allowed us to design without limitation and to ensure a seamless user experience. The solution is responsive, allowing access across mobile, tablet and desktop devices. It also foregrounds dedlyne’s unique take on communication within a crowded and often confusing landscape.

We knew there was a lot of data out there, and many different perspectives we could view it all from. So we spent a good amount of time and discussion figuring out what the main user journey would be, and what the purpose of the tool was at this initial stage. Through a combination of maps and smart, modular data visualisation, we were able to show the data at different geographical ranges, as well as the breakdown for each authority while also enabling straightforward comparisons.
The outcome of our first FutureFridays sprint was a value proposition:
Our Net Zero Tracker helps local councils and their stakeholders understand how they are performing against net zero targets, by creating a novel, yet easily understood benchmark to monitor progress and encourage improvement. Unlike existing reporting that can be data-heavy, action-light and fail to engage.
The success of our initial FutureFridays sprint led to a continued phase of development, working with dedlyne on the latest set of government data published in June 2023, and tailoring the solution to a more focused brief.
We developed the Net Zero Tracker as an MVP for net zero progress tracking in UK local authorities. It’s built with future iterations in mind, and with consideration for how the tool can be easily updated and integrated further with third-party data.
In light of the increased focus on net zero within the media and political realms of late, plus increasing warnings we’re seeing almost every day on climate change, we’re excited that the tool is now live and eager to engage with local authorities to see how the Net Zero Tracker can help them drive positive action on their SDGs and net zero targets.
Our Net Zero Tracker for emission deadlines enables local authorities and climate decision-makers to:
– View local authority net zero performance in a simple date format
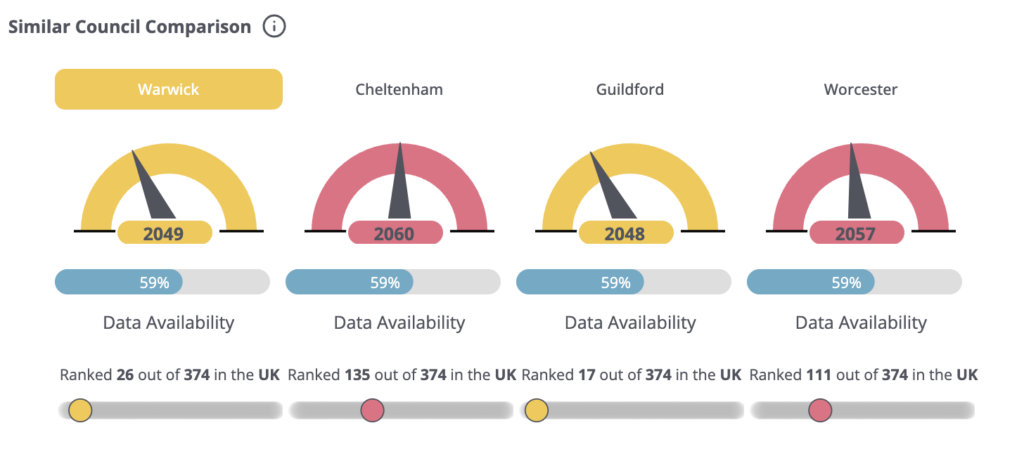
– Compare themselves against other local authorities
– View the data broken down by different sectors

Some key findings from the Net Zero Tracker, as of July 2023:
– 0% of local authorities are on track to hit net zero by 2030.
– 10% of local authorities are on track to hit net zero by 2050.
– 11 local authorities are currently on track to never hit net zero.
While this project was our own FutureFridays initiative, as next steps we’re looking to engage with local authorities, to show them what value we can bring to their data, and equally to hear from them about what challenges they face and how our tool can (and can’t yet) help them.
The Net Zero Tracker joins our Climate Action Dashboard in our suite of data-led sustainability reporting tools. Speak to Stewart to find out more.
With thanks to our partners at dedlyne.
![]()