In sustainability and climate action, organisations have a wealth of information available, and a wide variety of stories that need to be told.
With increased regulatory focus emerging in the EU and set to drive ESG globally, now is the time to get this data in order.
Tackling the sustainability reporting challenge
The crux of the sustainability reporting challenge is that two key factors are disconnected: Data and People.
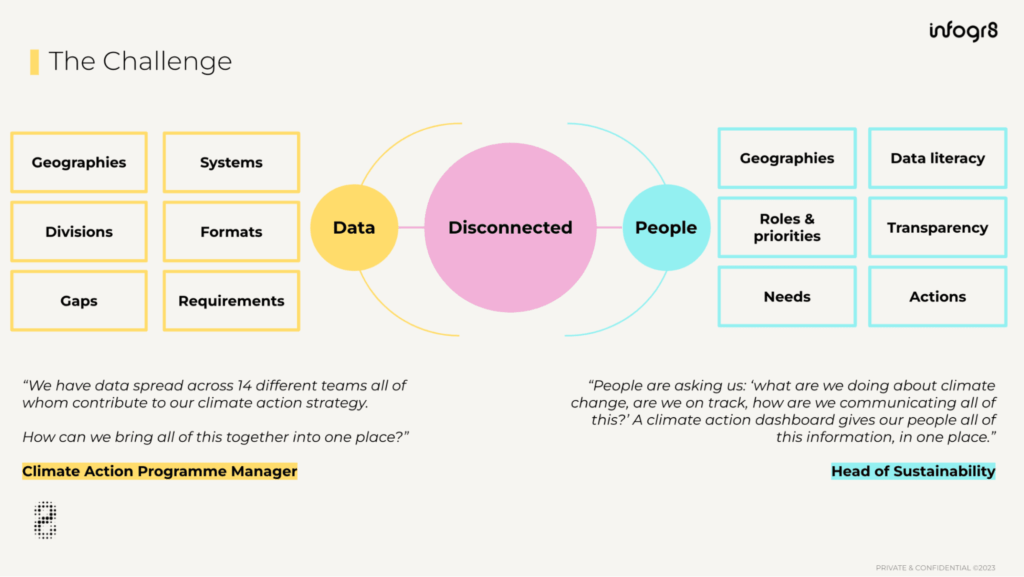
Typically, sustainability data is spread across different geographies, in different systems, divisions and formats – often with varying requirements and data gaps.
And then there’s the users of the data involved. Multiple audiences with varied levels of data literacy, and all with different roles, responsibilities and needs.
Here are some of the things we were hearing from sustainability leads facing up to this challenge:
“We have data spread across 14 different teams all of whom contribute to our climate action strategy. How can we bring all of this together into one place?”
— Climate Action Programme Manager
“People are asking us: ‘What are we doing about climate change? Are we on track? How are we communicating all of this?’ A climate action dashboard gives our people all of this information, in one place.”
— Head of Sustainability
So how can organisations put sustainability at the heart of everything they do, especially if they don’t have a central hub for all their key sustainability data? And when they are able to unlock their data in one place, how could they make sure they’re telling the critical stories for everyone, at all levels, while inspiring real action?
At the moment, the most commonly used tools are static reports and Excel spreadsheets. Innately clunky, dense and difficult to engage with.
Increasingly, sustainability teams are dipping their toes into the world of business intelligence tools like Tableau or PowerBI, which are great for building rapid proof-of-concepts, but relatively few are creating bespoke, holistic and user-centred solutions.
But here at infogr8, our solution is a little different.
As part of our FutureFridays innovation lab, we came up with an interactive, data-led Climate Action Dashboard tool that can be deployed by public-sector organisations and private companies alike.
The Climate Action Dashboard is interactive and customisable for different user audiences – including local residents, business owners, or committee members – and showcasing the areas of local government that matter most to them.
Our prototype dashboard was created with local authorities in mind, but the solution is scalable to any business, in any sector or industry, where sustainability reporting is a priority.
Our Climate Action Dashboard enables a range of audiences to understand the organisation’s climate action journey, to monitor performance, and to track progress towards net zero and other sustainability targets.
In one module, it delivers the critical information that the whole organisation needs, while enhancing its credibility with a range of external stakeholders.
Here are three key challenges that this dashboard solves for sustainability teams:
1. Reconnecting disconnected data
The Climate Action Dashboard enables teams to pull together once-disconnected data from across the organisation into one centralised place. It then reproduces that data in consistent formats so the content can be shared on multiple platforms.
Armed with a practical data system, teams can then spend less time wrangling disparate data streams and more time implementing their climate action plans.
In the example shown above, all the salient climate action information (buildings, transport, climate resilience) is displayed to a local business owner, all in one easily accessible space.
2. Boosting transparency and accountability
By presenting climate action data in a more accessible way, any organisation stand to raise their reporting standards in the eyes of their key audiences.
Internally, teams can gain greater confidence in their decision-making based on the data at hand. Externally, credibility can be enhanced with a range of stakeholders.
No more static reporting or dry PDF downloads. Instead, organisations can offer up a future-proofed data platform built for a faster-moving world.
Our dashboard gives teams space to show their stakeholders the KPIs that matter, the targets they’re setting, and how they plan to reach those targets and track progress towards them, all in one place. This level of visibility builds trust with various audiences, adding several layers of substance to the organisation’s messaging around net zero.
3. Connecting with audiences in more meaningful ways
Static reports can’t talk back to you or inform your decision-making. Through user-generated, on-the-ground feedback, our Climate Action Dashboard can.
The Climate Action Dashboard joins our Net Zero Tracker, co-developed with dedlyne, in our suite of data-led sustainability reporting tools designed specifically for local authorities. To find out more, speak to Stewart, GM of our Sustainability pod.