Supply-chain traceability: How to use emissions data in the fight against greenhouse gases
Reading time
Category
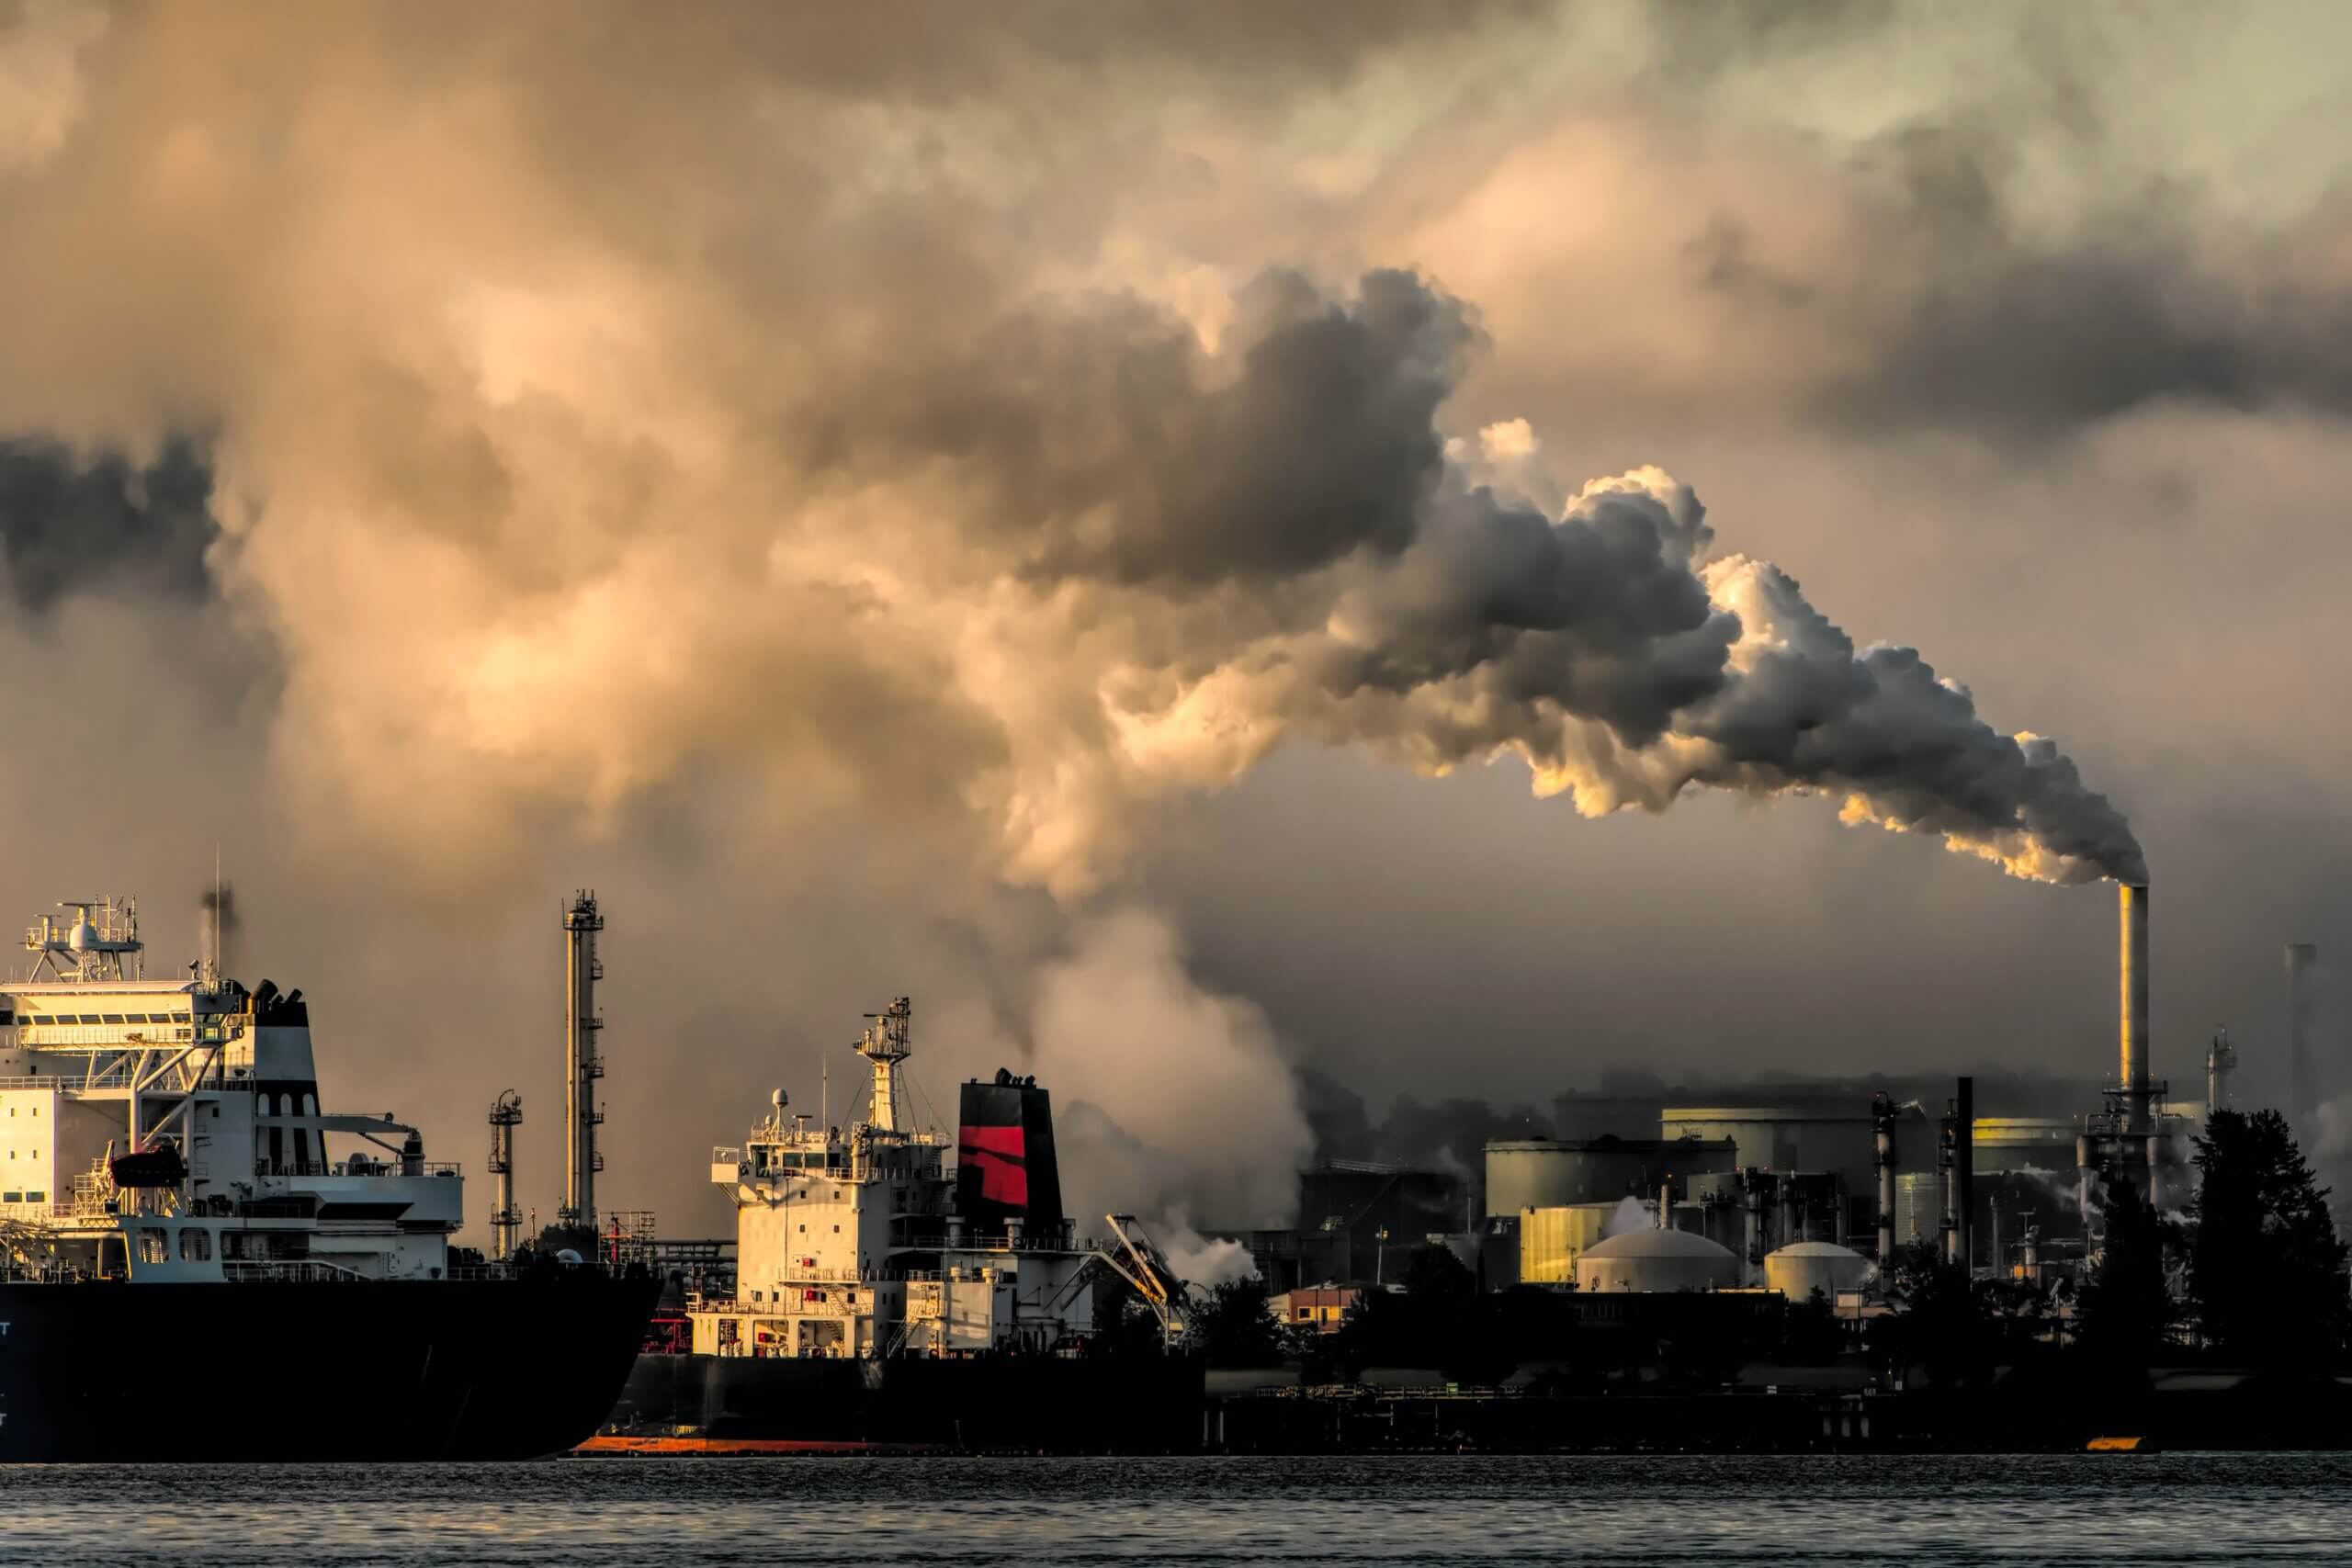
Image Credit: Chris LeBoutillier
In this series, we’re taking a deep dive into traceability within supply chains. We’ll look at the key advantages around understanding the journey from raw material to final product, and the role that data – and more pertinently, data visualisation – can and does play in unlocking these benefits.
Emissions Data and the Fight Against Greenhouse Gases
.
In the previous article in our Traceability series, we looked at forced labour: what it is, why it’s difficult to get a handle on, and how mapping out your supply chain in a visually engaging way can help you confront the challenges it presents. This week, we’re moving onto greenhouse gas (GHG) emissions.
What are GHGs?
.
Without getting too deep into the science, greenhouse gases are a group of gases that trap heat. They’re not inherently bad; without them, overnight temperatures on Earth would drop to -18°C and make life pretty difficult. The problem is that, ever since the industrial revolution, humans have been pumping larger and larger amounts of these gases into the atmosphere with reckless abandon, through the burning of fossil fuels like oil, coal and natural gas.
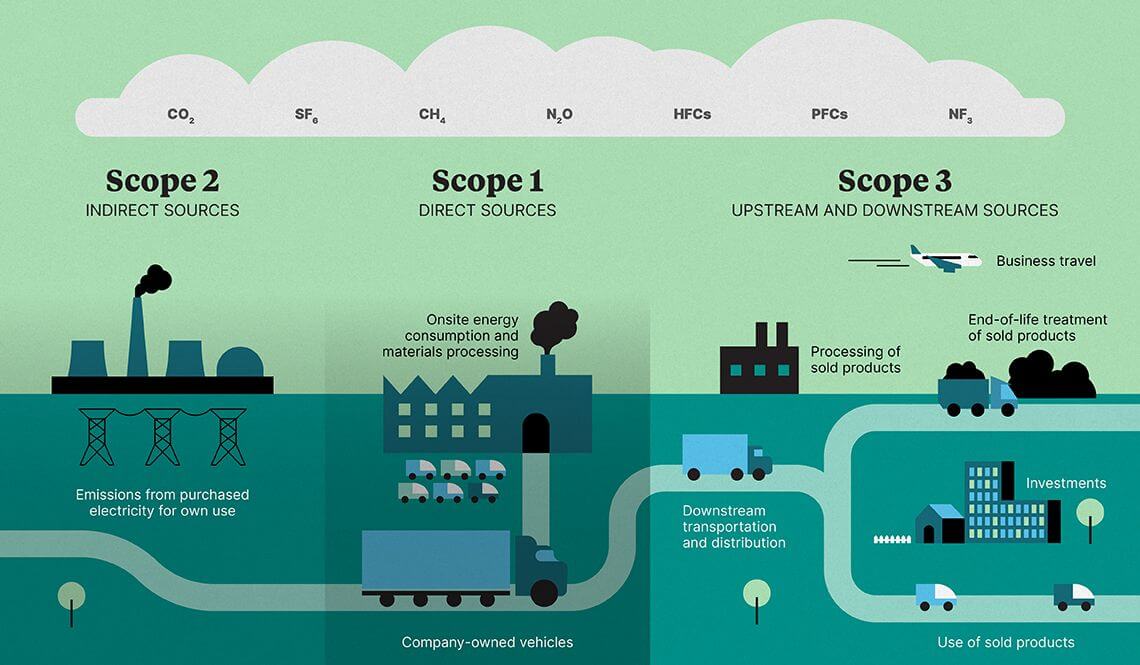
Image credit Oliver Wyman forum
What does this have to do with supply-chain traceability?
.
Given that around 70% of an organisation’s carbon footprint falls under Scope 3 in the diagram above (indirect emissions within the value chain), supply chains account for a substantial amount of an organisation’s emissions.
Under the Purchased Goods & Services and Capital Goods categories, many organisations rely on Environmentally-Extended Input Output (EEIO) models to calculate the bulk of their Scope 3 emissions. These models use high-level standardised emission factors and calculate emissions based on volume of spend. So, in theory, the only way to ‘reduce’ your emissions is to ‘reduce’ your spend.
However, a more innovative approach states that if you have your supply chains mapped out and are able to get the right data from them, you can start to measure your emissions far more accurately.
Why does addressing supply-chain emissions matter?
.
As pretty much every corporation, government and local authority on the planet are pledging to hit ‘net zero’ emissions anytime between 2030 and 2050, we have to ensure that these pledges extend beyond those within direct control (Scopes 1 & 2); otherwise, the vast majority of emissions (Scope 3) could potentially be ignored.
Yes, it’s an exceptionally complex challenge, but that isn’t a good enough excuse to kick this particularly unwieldy can down the road. Organisations cannot just rely on their suppliers to ‘do the right thing’ – they need to take ownership and drive the change we need to see. As inaction and apathy slows down progress, the tipping point of 1.5°C of global warming edges ever nearer.
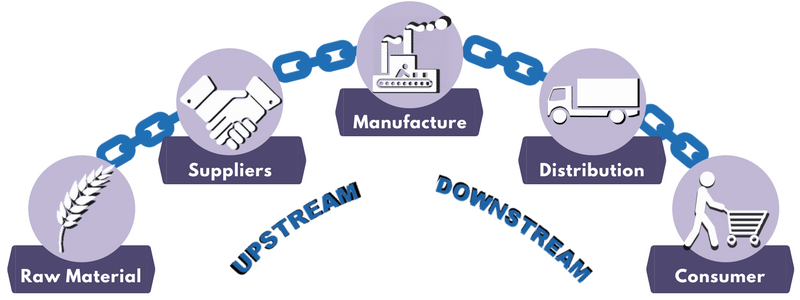
Image Credit mfgtec.org
What’s the data challenge when it comes to greenhouse gas emissions?
.
The data challenge provoked by GHG emissions is incredibly daunting, and it keeps many sustainability professionals up at night. To break it down into very simple terms, though, an organisation needs to collect and interpret data on the supply chains for all their products, from raw materials through to finished products.
Identifying every link in the supply chain can be challenging enough as it is, but once the data starts rolling in, you can start to piece together your supply chain. The next step is to get operational data from as many of these suppliers as possible about what fuel sources they use to power their factory, and ideally, what proportion of their operation is dedicated to you.
Image credit: Sarah Johnson for thirteen23
How can data visualisation help in the fight against emissions?
.
Effective visualisation of this information enables everyone in your organisation to see your supply chain in a clear, understandable format. It allows them to drill down to the segments, sectors, markets, regions, and so on that really matter to them, and to understand where their challenges lie and how they fit within the bigger sustainability picture.
The nature of these challenges will vary, too. It could be that carbon-intensive fuel sources are being used where it may be possible to electrify using grid electricity instead, thereby emitting less CO2. There may be inefficient distribution loops within specific supply chains. Or it could be that you have gaps in your data. Visualising what you do have enables you to strategise on emissions and work to reduce your actual impacts.
Are you looking to learn more about how visualising your data can provide positive impact on sustainability?
I want to hear more from Stewart