Supply-chain traceability: Why forced labour matters
Reading time
Category
In this series, we’re taking a deep dive into traceability within supply chains. We’ll look at the key advantages around understanding the journey from raw material to final product, and the role that data – and more pertinently, data visualisation – can and does play in unlocking these benefits.
First, we’re focusing on the various types of labour risk, and forced labour in particular.
.
Why forced labour matters
Forced labour is defined by the International Labour Organisation (ILO) as “all work or service which is exacted from any person under the threat of a penalty and for which the person has not offered himself or herself voluntarily.”
27.6 million people are directly affected by forced labour across many industries around the globe. Here are just a few of the reasons why forced labour must be eliminated from any supply chain:
- Compliance with the law – forced labour within business operations or supply chains is illegal in the UK and the US. Non-compliance is likely to result in fines, trading restrictions or even prison sentences.
- Reputation – there are many instances of major brands taking a reputational hit following revelations of forced labour in their supply chains.
- Human rights – forced labour is a violation of basic human rights, so it’s incumbent on businesses to provide workers with humane working conditions.

What are the challenges in tracing forced labour in supply chains?
Despite its illegality, forced labour can be incredibly difficult to identify and prove directly. To combat this, the International Labour Organization (ILO) created a set of forced labour ‘indicators’ to help people on the front line – union officials, NGOs and law enforcement – to identify where workers may be at risk of forced labour situations. Evidence of just one of the ILO’s 11 indicators implies that forced labour is present in an organisation and may give cause for further investigation.
The ILO indicators also have a compounding effect. If several indicators are triggered in conjunction, this implies that the effects on workers have intensified, and a deeper investigation is required immediately.
While tracing forced labour within a supply chain is difficult enough, identifying the key links in the chain can be a challenge in itself. Netflix has even dedicated an entire documentary to the cacao supply chain, illustrating just how complex these international mechanisms can be.
How can data help companies respond to these supply-chain challenges?
First and foremost, it’s critical to map out your actual supply chain, including:
- Your direct suppliers
- Their suppliers
- Suppliers of your suppliers’ suppliers
An industry example
Let’s say you’re a fashion retailer ordering 100,000 cotton t-shirts.
To ensure total supply-chain traceability, you’ll need to understand the workforce ramifications of each and every touchpoint in the journey from cotton plant to retail store shelf:
- Where the raw cotton comes from
- Where the cotton is made into fabric
- Where the dye comes from
- Who transports the raw materials
- Where the t-shirts are cut and sewn
- Where they are dyed
- Who transports the different materials along the way
.
The data-driven solution – Visualising for more effective decision-making
The sheer amount of data involved in the above would make any meaningful interpretation in the classic Excel format next-to-impossible. You would just end up getting stuck in the weeds, unable to see the bigger pictures and trends contained in your data streams.
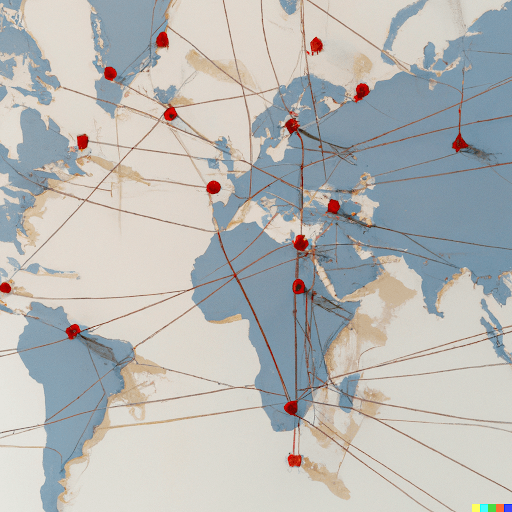
It’s here where plotting out the supply chain visually in map form can make all the difference.
Mapping your data would enable you to see exactly where your suppliers are based and how your products progress geographically through the product lifecycle. Applying filters to a map would then enable you to drill down into the specific areas of the supply chain that are of most interest to you; from there, you can embark on deeper fact-finding missions to glean the most impactful information and make key decisions accordingly.
A great example of this visual data-driven approach is the Open Apparel Registry. Imagine you’re a multinational sports brand like Adidas, and you want to understand where forced labour might be a factor in your supply chain. Looking through an Excel file, an ERP system or a database can never give you and your stakeholders the same impact as this kind of visual data – in an instant, you’ll know exactly where to focus your efforts.
Are you looking to learn more about how visualising your data can provide positive impact on sustainability?
I want to hear more from Stewart