Data visualisation
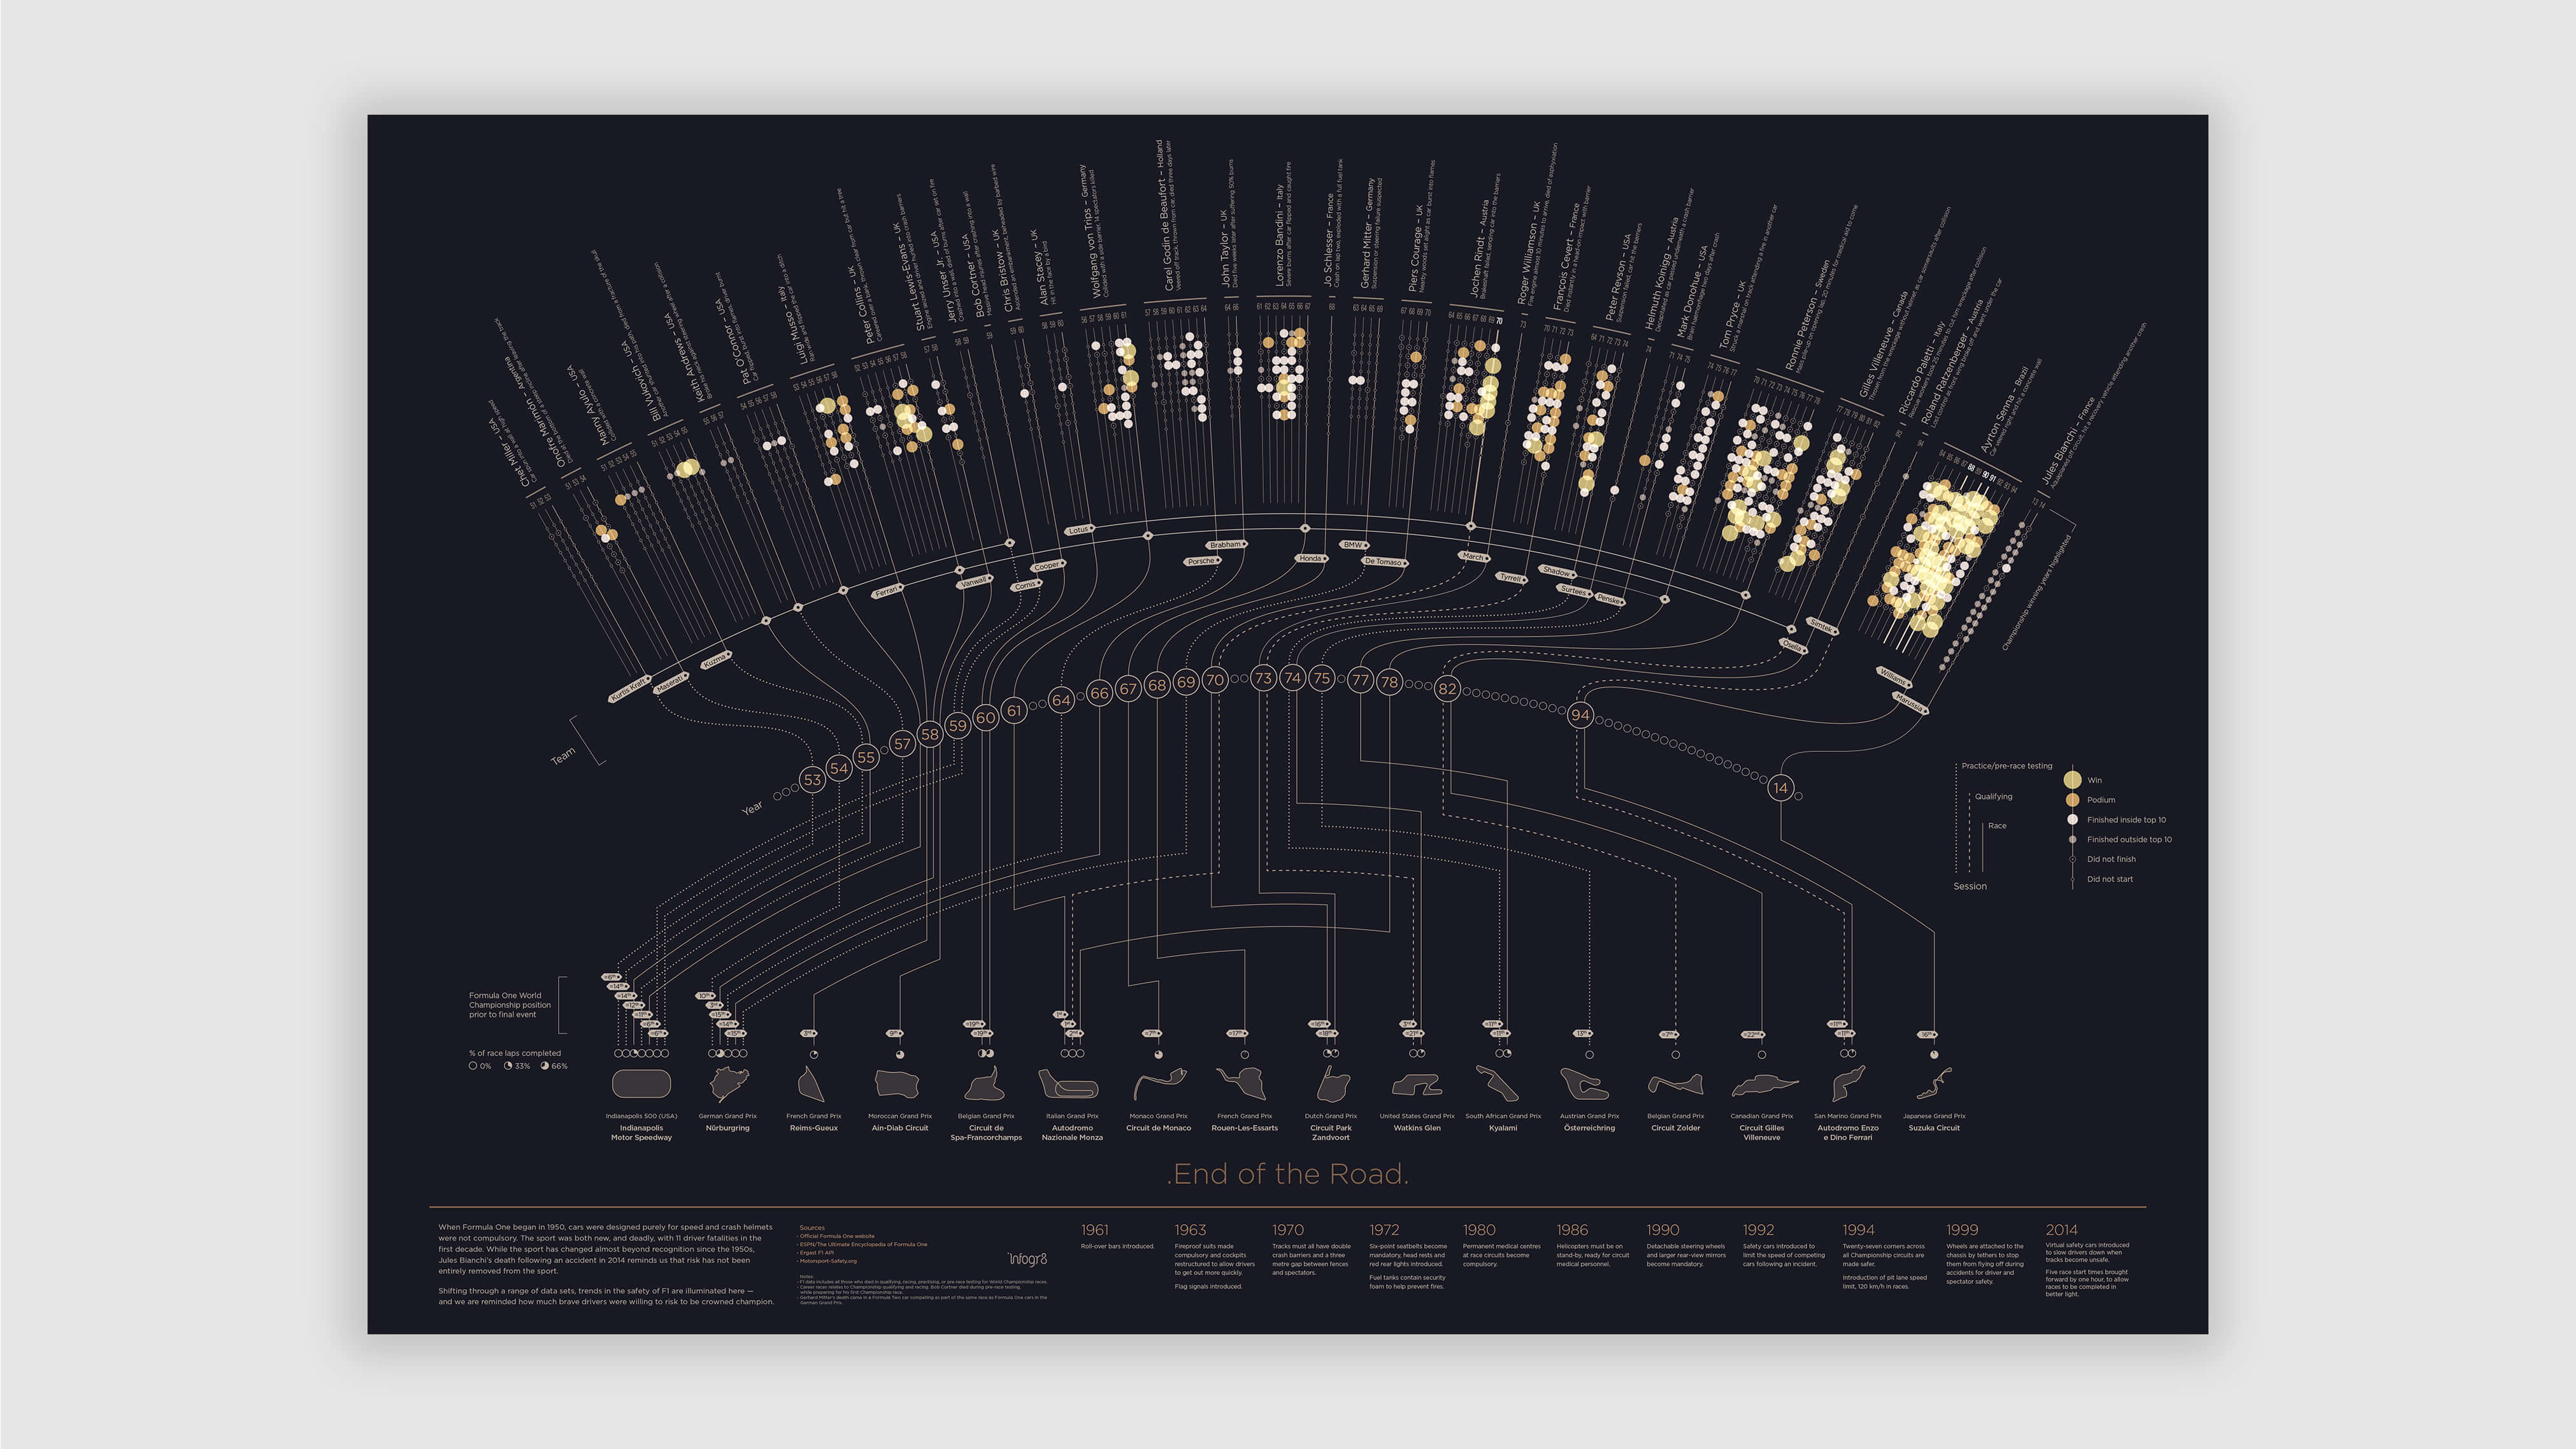
Present quantitative data within a creative visualisation that your audience can enjoy engaging with
Benefits
-
A static asset where data is presented with a clear narrative
-
Allows the audience to rapidly identify trends across multiple data sets, rather than read through data laboriously
-
Can be a beautiful stand-alone art piece ideal for physical spaces, and a powerful hero piece to support other content
Data for Everyone®
- Telephone
- +44(0) 207 193 9594
- Address
Soho Works White City,
Television Centre,
101 Wood Lane,
London,
W12 7RJ
- [email protected]
Newsletter
Join the data for everyone club to get the very latest insight, tools & know how before it gets to anyone else.
Talent
Come work with us!
We are always looking for great people to join our growing network of Global data experts.
See opportunities
We are always looking for great people to join our growing network of Global data experts.
© infogr8 Ltd. 2026 All rights reserved