Spotify


Challenge
-
How do you bring more evidence to a complex theory and then communicate it for wider business engagement?
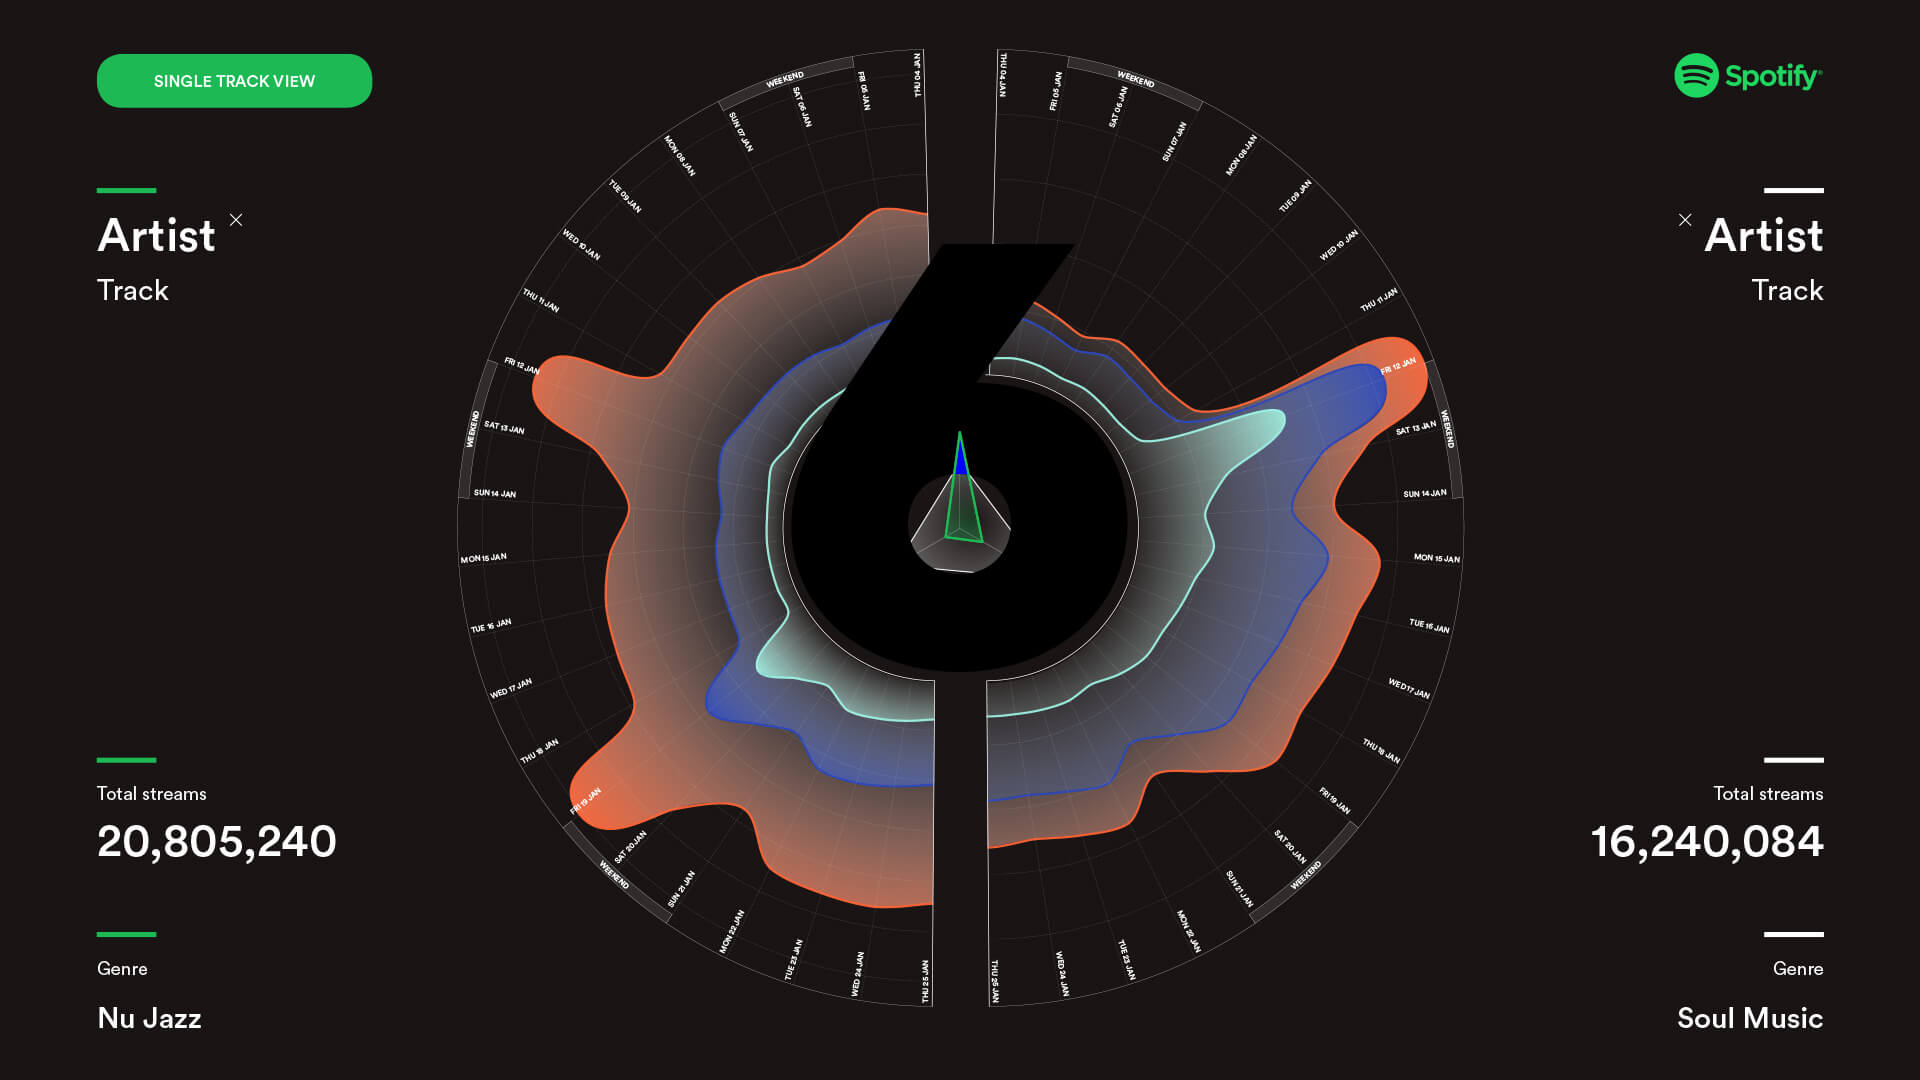
infogr8 have been commissioned by Spotify as a strategic partner to provide data design consultation. Renowned for being rooted in a data driven culture, Spotify are keen to extend on this with a desire to develop insight from a primitive state into a more creative and visual way. One that drives excitement and decision making for music industry professionals. As part of several work streams, Spotify challenged infogr8 with an initial set of its proprietary data to establish whether its theory of early streaming consumption habits hold true.
Solution
-
infogr8 delivered a vision for how Spotify’s data language could be presented in a multitude of exciting ways, one that resonates across it’s departments, functions and that can reach further afield to connect with its key partners.
A more human interpretation was considered through matching data storytelling with a core creative – one of these factors being to personify patterns in the data for wider teams to understand and help aid retention.