DNV GL - Energy Transition Outlook Publications
Challenge
-
Reinforce DNVs position as a thought-leader by creating a standout best in class report
-
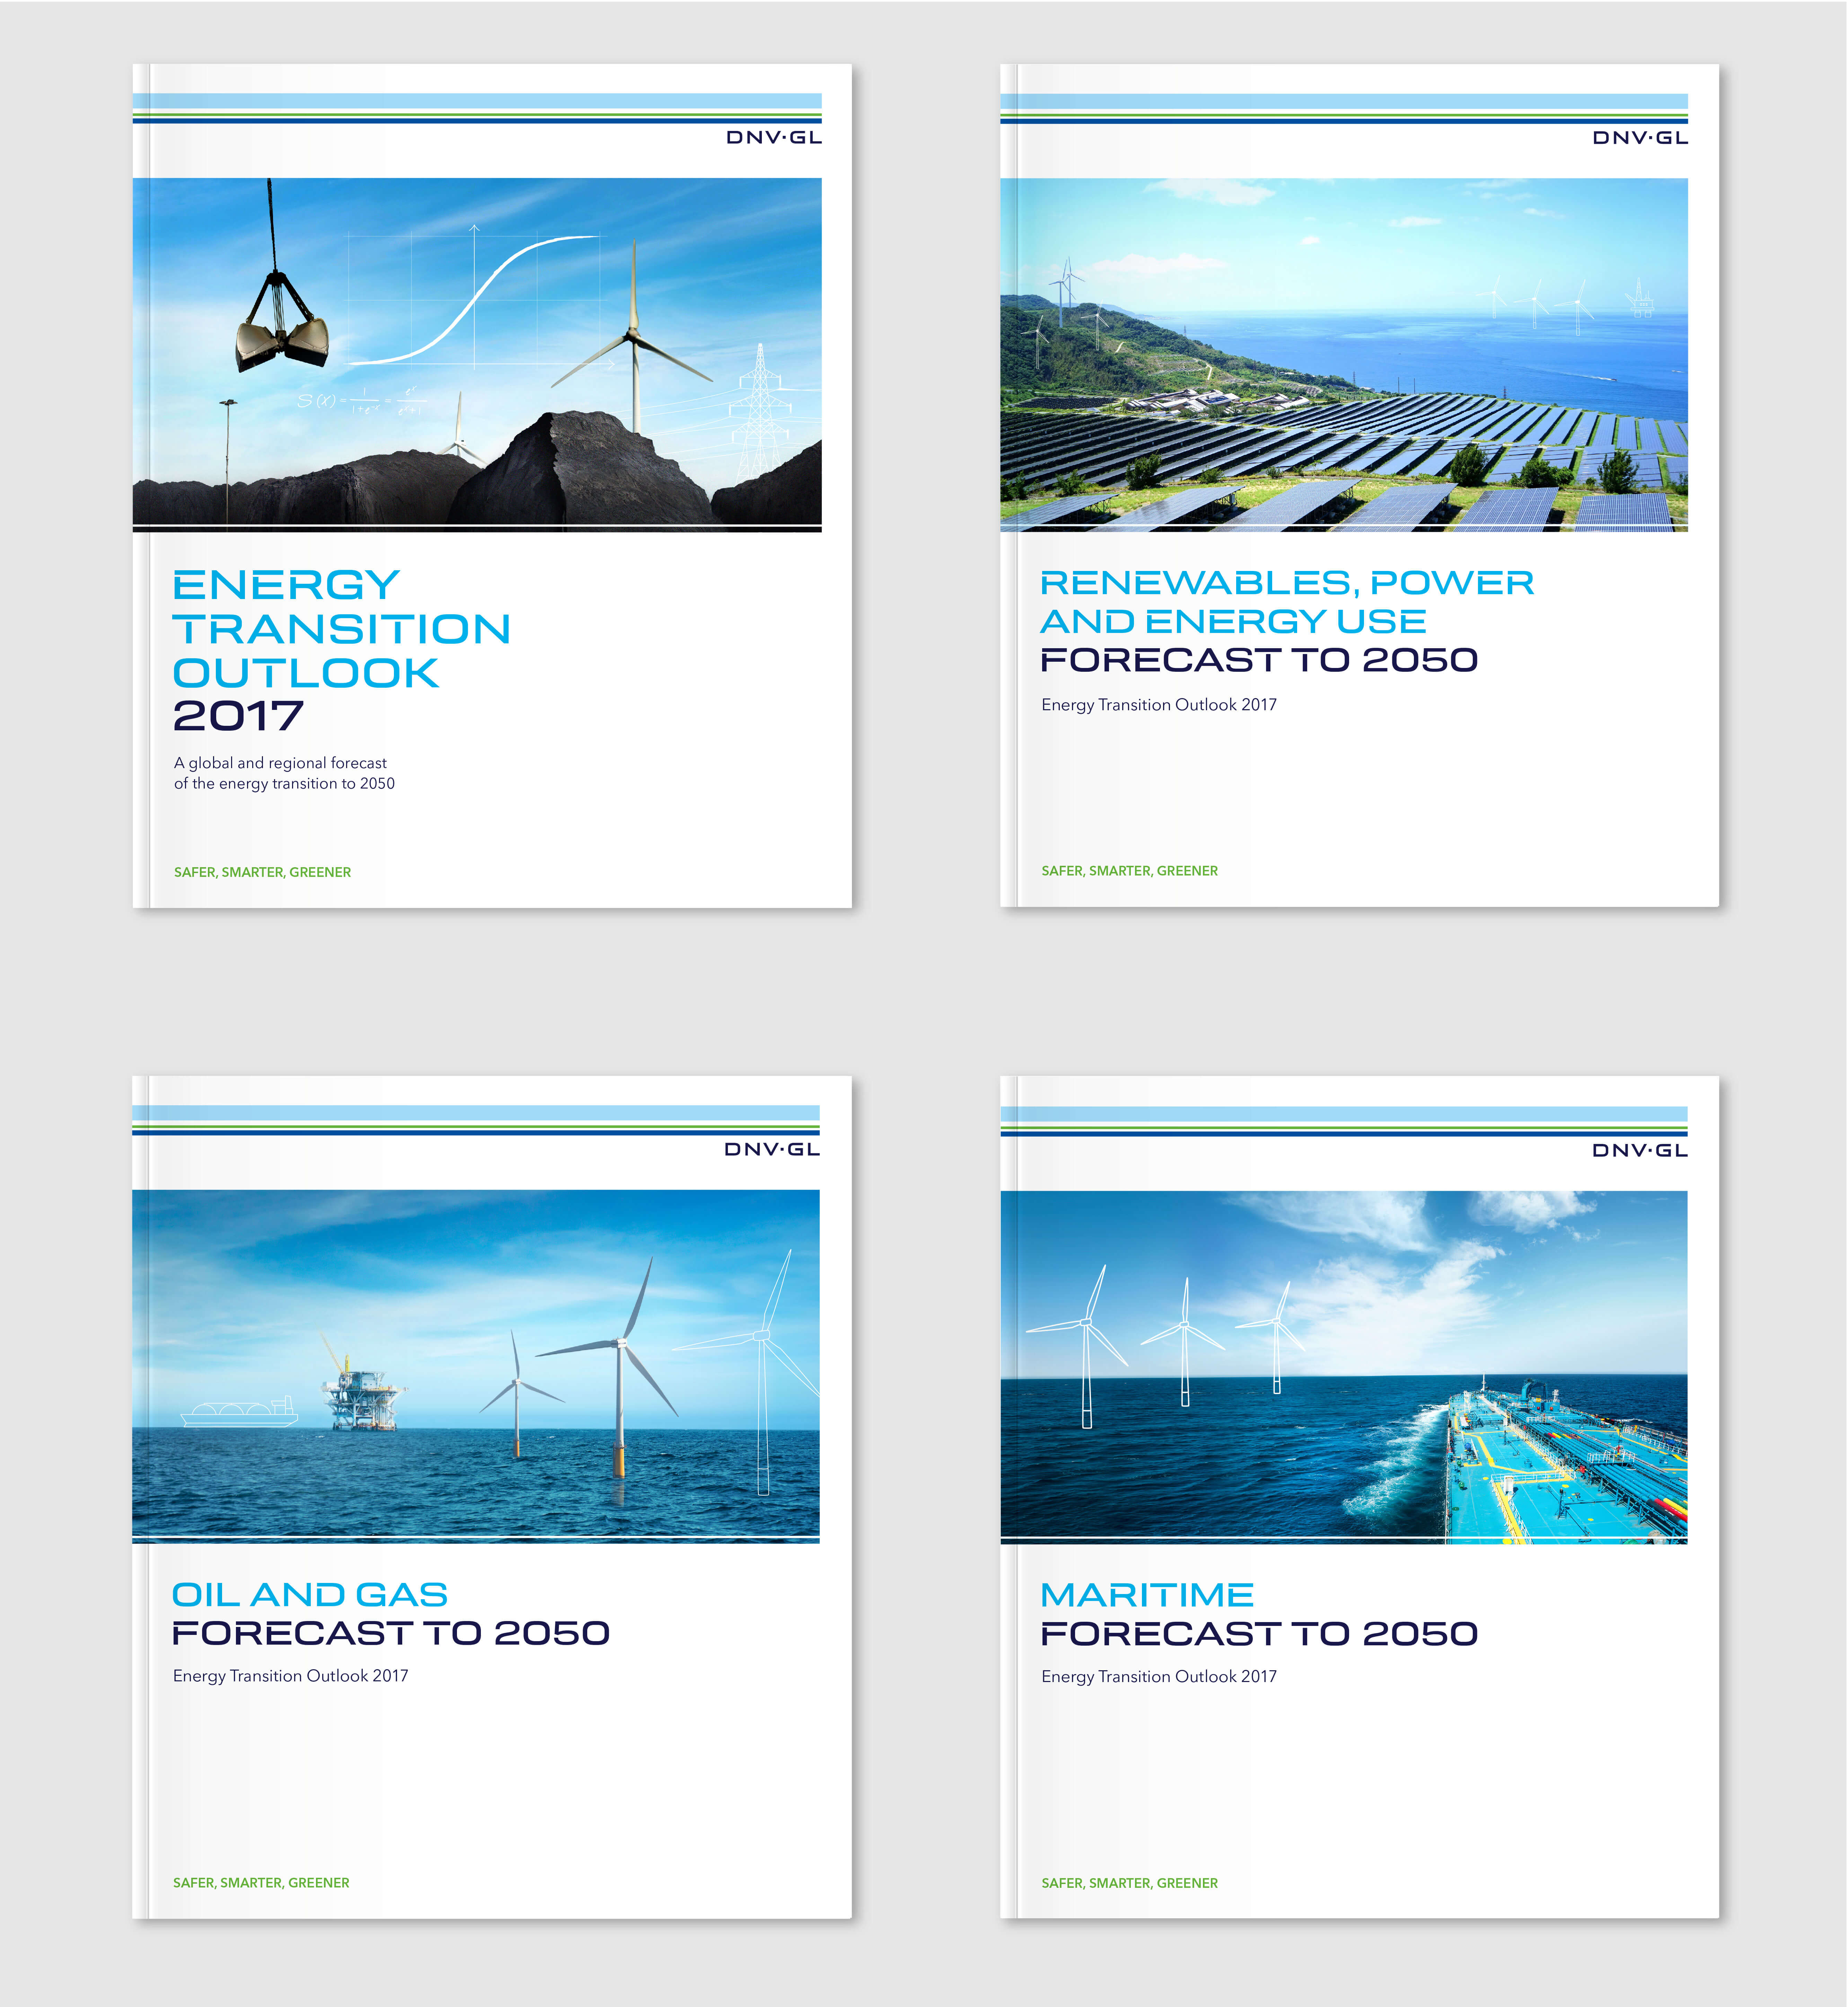
Create a standout report as part of their inaugural ‘Energy Transition Outlook’, outlining the growth in green energy solutions and the decline in coal, oil, and gas.
-
The teams at DNV GL had amassed a wealth of deep research and were seeking a creative delivery solution.
-
They needed to present their findings visually in a distinctive style, reinforcing their independent voice.
-
The infogr8 team worked to not only to reinforce DNV’s position as thought leaders, but to also help them stand out in a very traditional and formal industry by creating compelling coffee table data art.
Solution
-
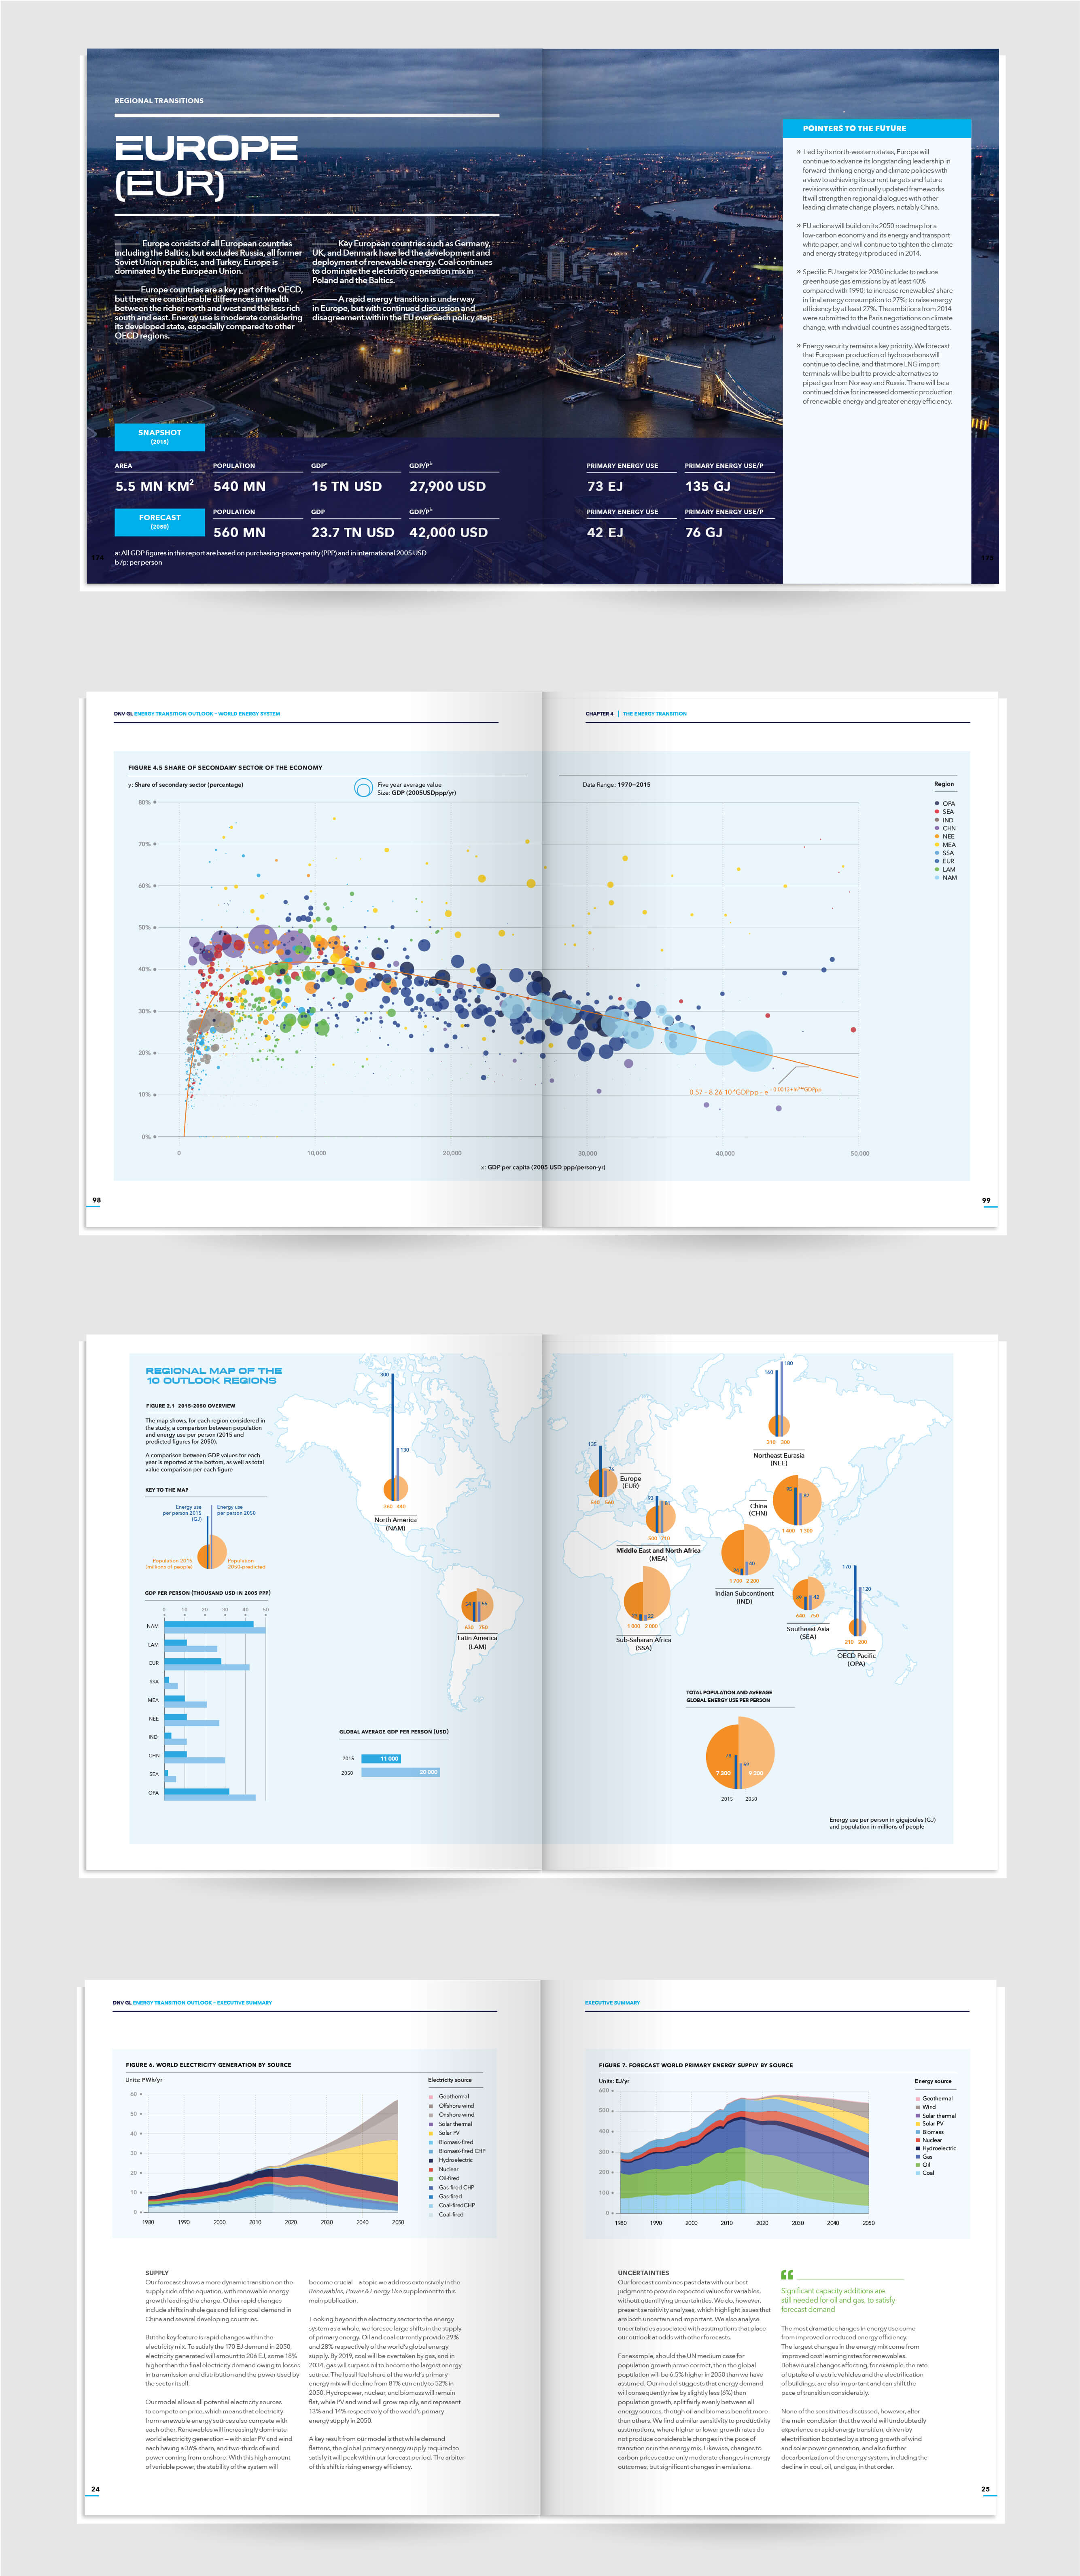
A new, fresh chart style for DNV to ensure readability and effective visual encoding of data, whilst still adhering to brand guidelines. We conducted colour blindness and user testing to ensure it was usable to as many readers as possible
-
We presented the range of insightful data in a visually captivating way so that it could be easily understood and complement the story.
-
Results