ViiV
Challenge
-
ViiV Healthcare is a world-leading pharmaceutical organisation, specialising in treatments and preventative medications for HIV/AIDS. They wanted to create an interactive installation showcasing the efficacy and safety of their new drug, Dolutegravir, versus all other approved medications indicated for the treatment of HIV, to be displayed at major HIV congresses across North America.
-
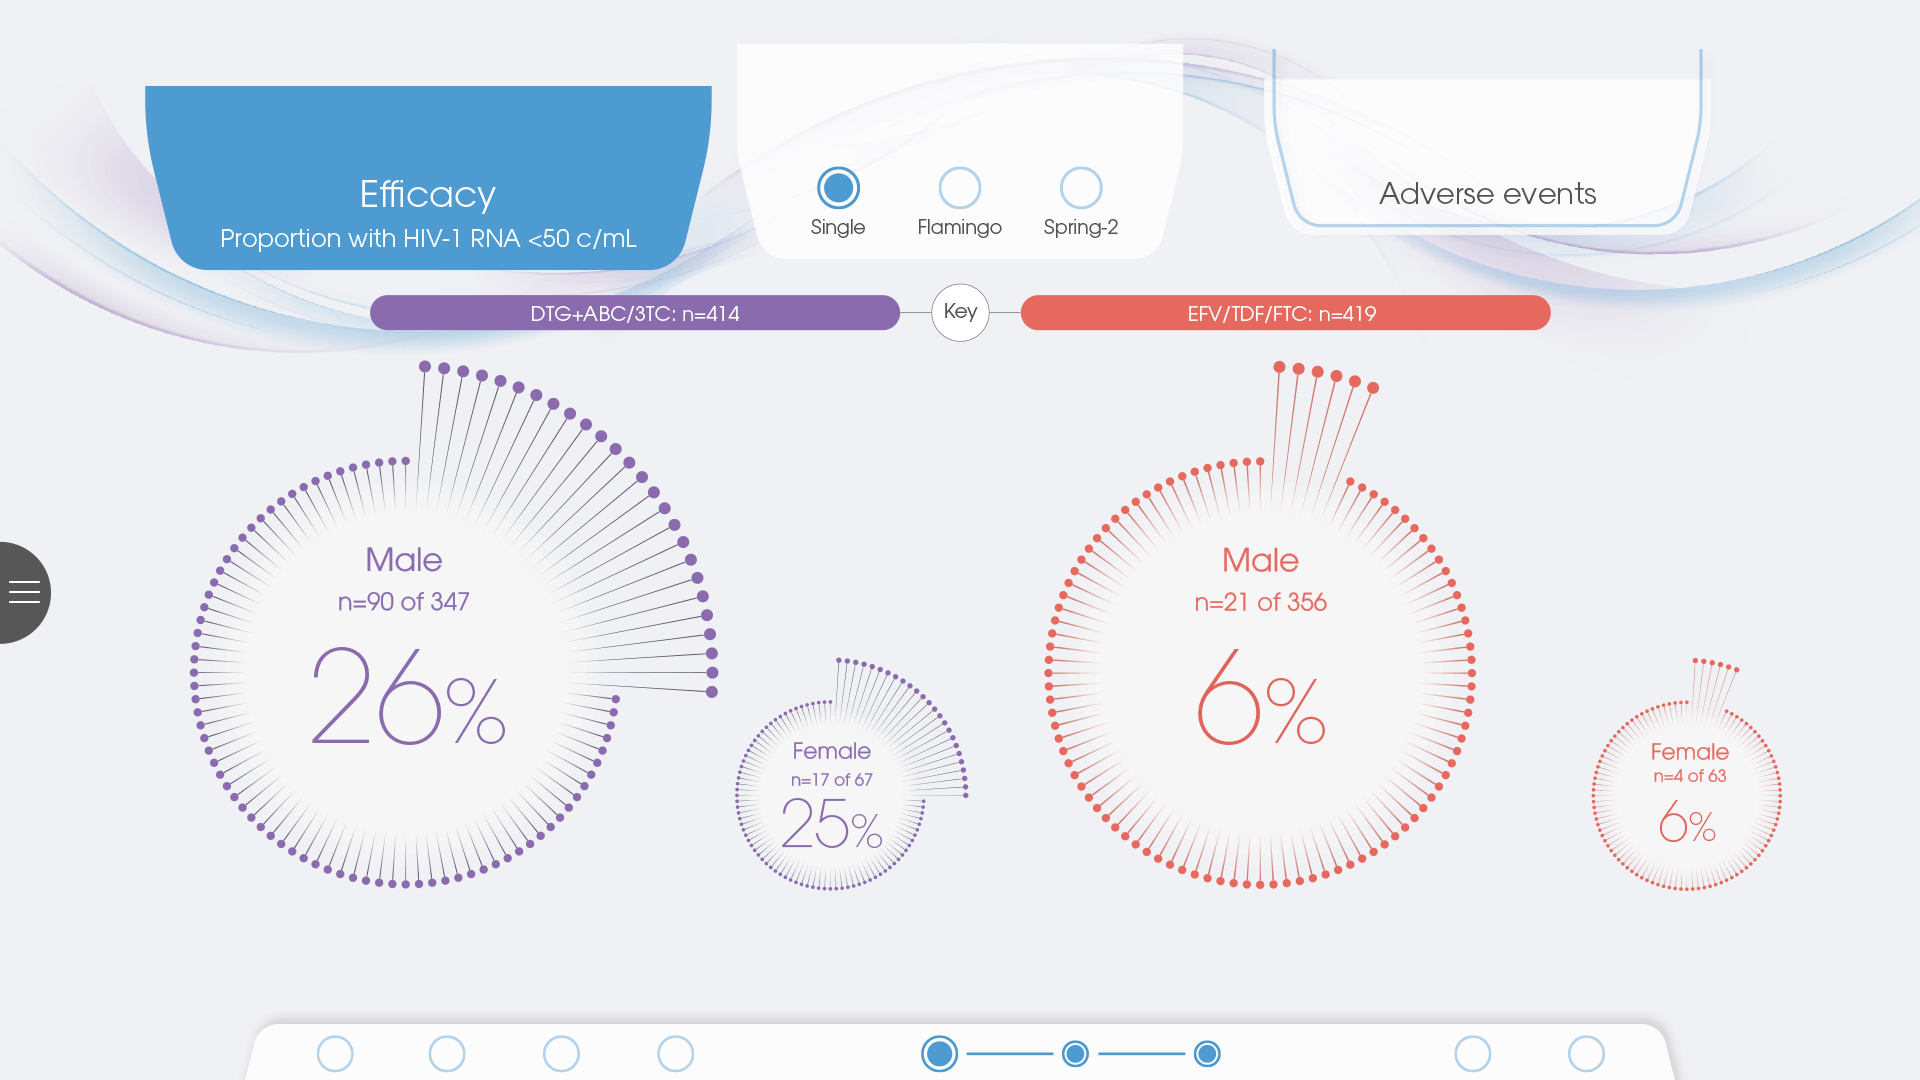
The main aim of the installation was to allow healthcare professionals to explore clinical trial data and compare efficacy and adverse events incidence against the complete HIV treatment landscape, based on multiple sources of the most recent published data.
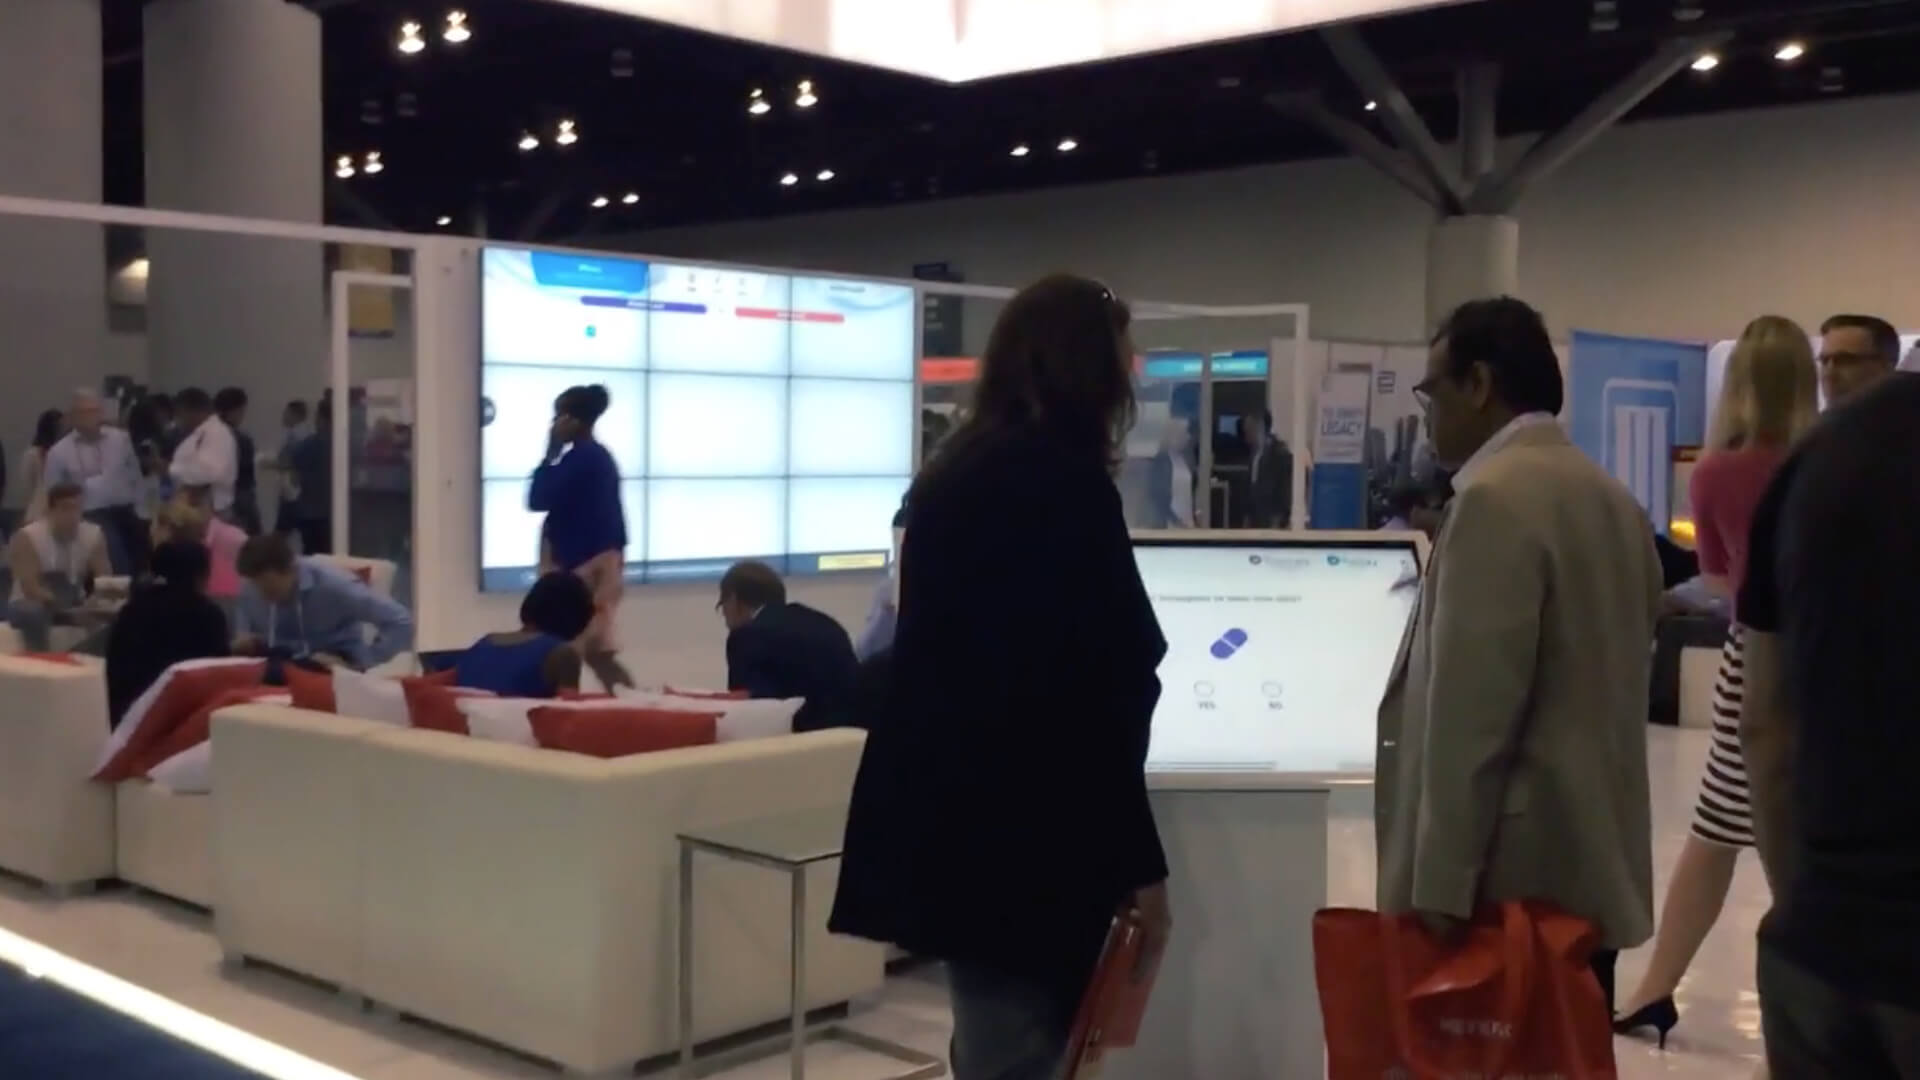
Our task was to create an interactive installation that would allow congress attendees to explore the data on large touch-screens located at ViiV’s exhibition stand. to facilitate deeper and meaningful conversations with ViiV scientific affairs team members located at the booth.
Solution
-
Once the data had been reviewed it was decided that the data from all 3 late-phase clinical trials of dolutegravir would be included to provide the most comprehensive picture, that could allow users to switch between each trial and compare against the current HIV treatment landscape. We would also allow the user to explore data from various stages across each trial, with filters applied to provide a deeper understanding of results across specific demographics.
There was a lot of discussion, particularly about how best to display adverse events data, that would allow users to see what specific side effects were reported across the different studies versus the wider treatment landscape, as this is an area where the ViiV treatment has proven superior to its competitors.
After further refinements and meetings with GSK, ViiV and our partners Pharmiweb, final design recommendations were signed off and the development team went into production of the final version, with the entire process taking less than 3 months to complete.
Results
Bronze, Pharmaceutical Marketing Society Craft Award for Digital Interactive
Silver, Pharmaceutical Marketing Society Digital Awards for HCP Education and Support and Digital Solutions for Congresses/Symposia/Meetings