Harvard Kennedy School's Workforce Almanac
Challenge
-
In the US, the future of work requires the reskilling and upskilling of workers of all levels of education. With more than 60% of the country’s workers not holding a bachelor’s degree, workforce training has become increasingly prominent. But this multi-billion dollar sector is largely overlooked due to its fragmented nature.
The Harvard Project on Workforce wanted to better understand and portray the interconnected ways in which HE institutions, apprenticeship providers, nonprofits and private firms train American workers. How is this training provision spread across the country, and how is it classified?
Solution
-
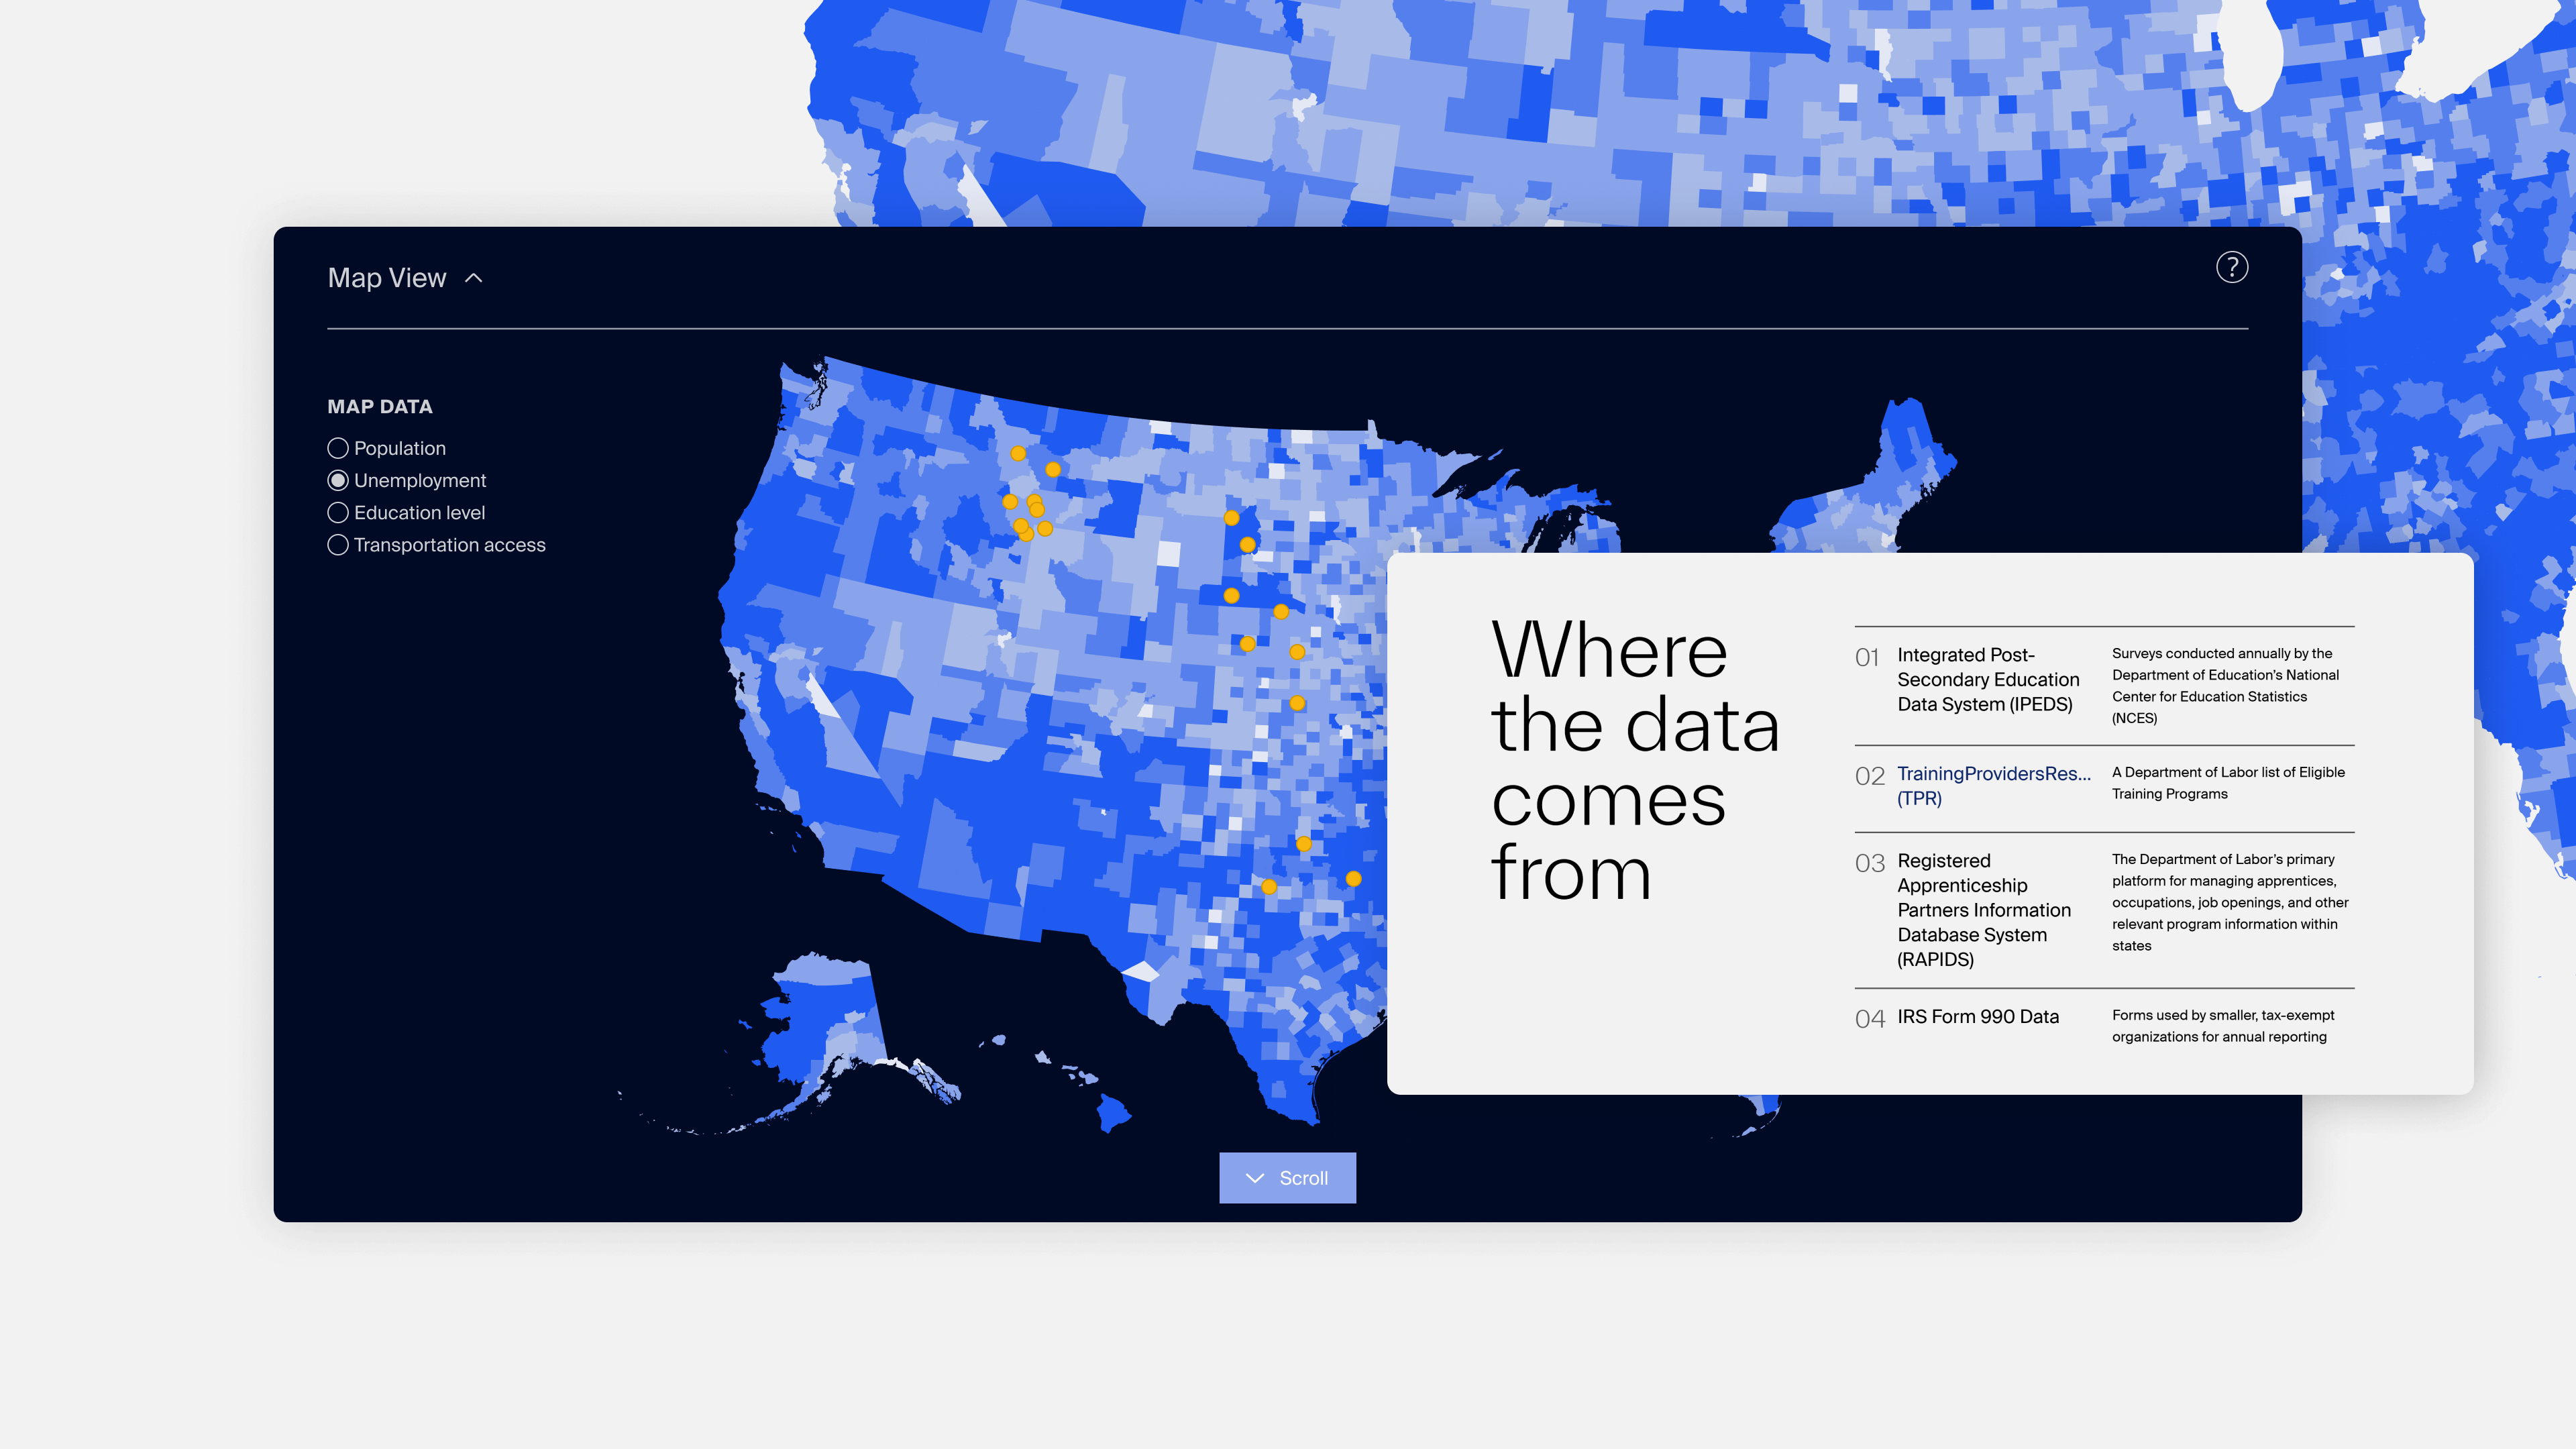
In its first iteration, we took the novel data set and mapped out nearly 17,000 providers of workforce training across the US, defined as short-term, post-high school training opportunities in which learners can gain work-relevant skills to help them find a job. This system-level view of workforce development was the first of its kind.
Adding a deeper level of analysis, we then unlocked U.S. Census data and overlaid it across the map of training providers. This gives the user (be they a researcher, policymaker or practitioner) a set of tools to start to understand previously unseen trends at the macro level.
In this way, the interactive portal presents a more accurate and comprehensive picture of non-traditional worker development pathways, with multiple use cases in mind:
- Training providers can gain insight into areas for development and visibility.
- Policymakers can make more informed decisions around funding and resource allocation.
- Employers can respond more effectively to their existing skills gaps through short-term training programmes.
- Researchers can form a more accurate picture of workforce training provision at the county, state and federal levels.
Deep-dive
-
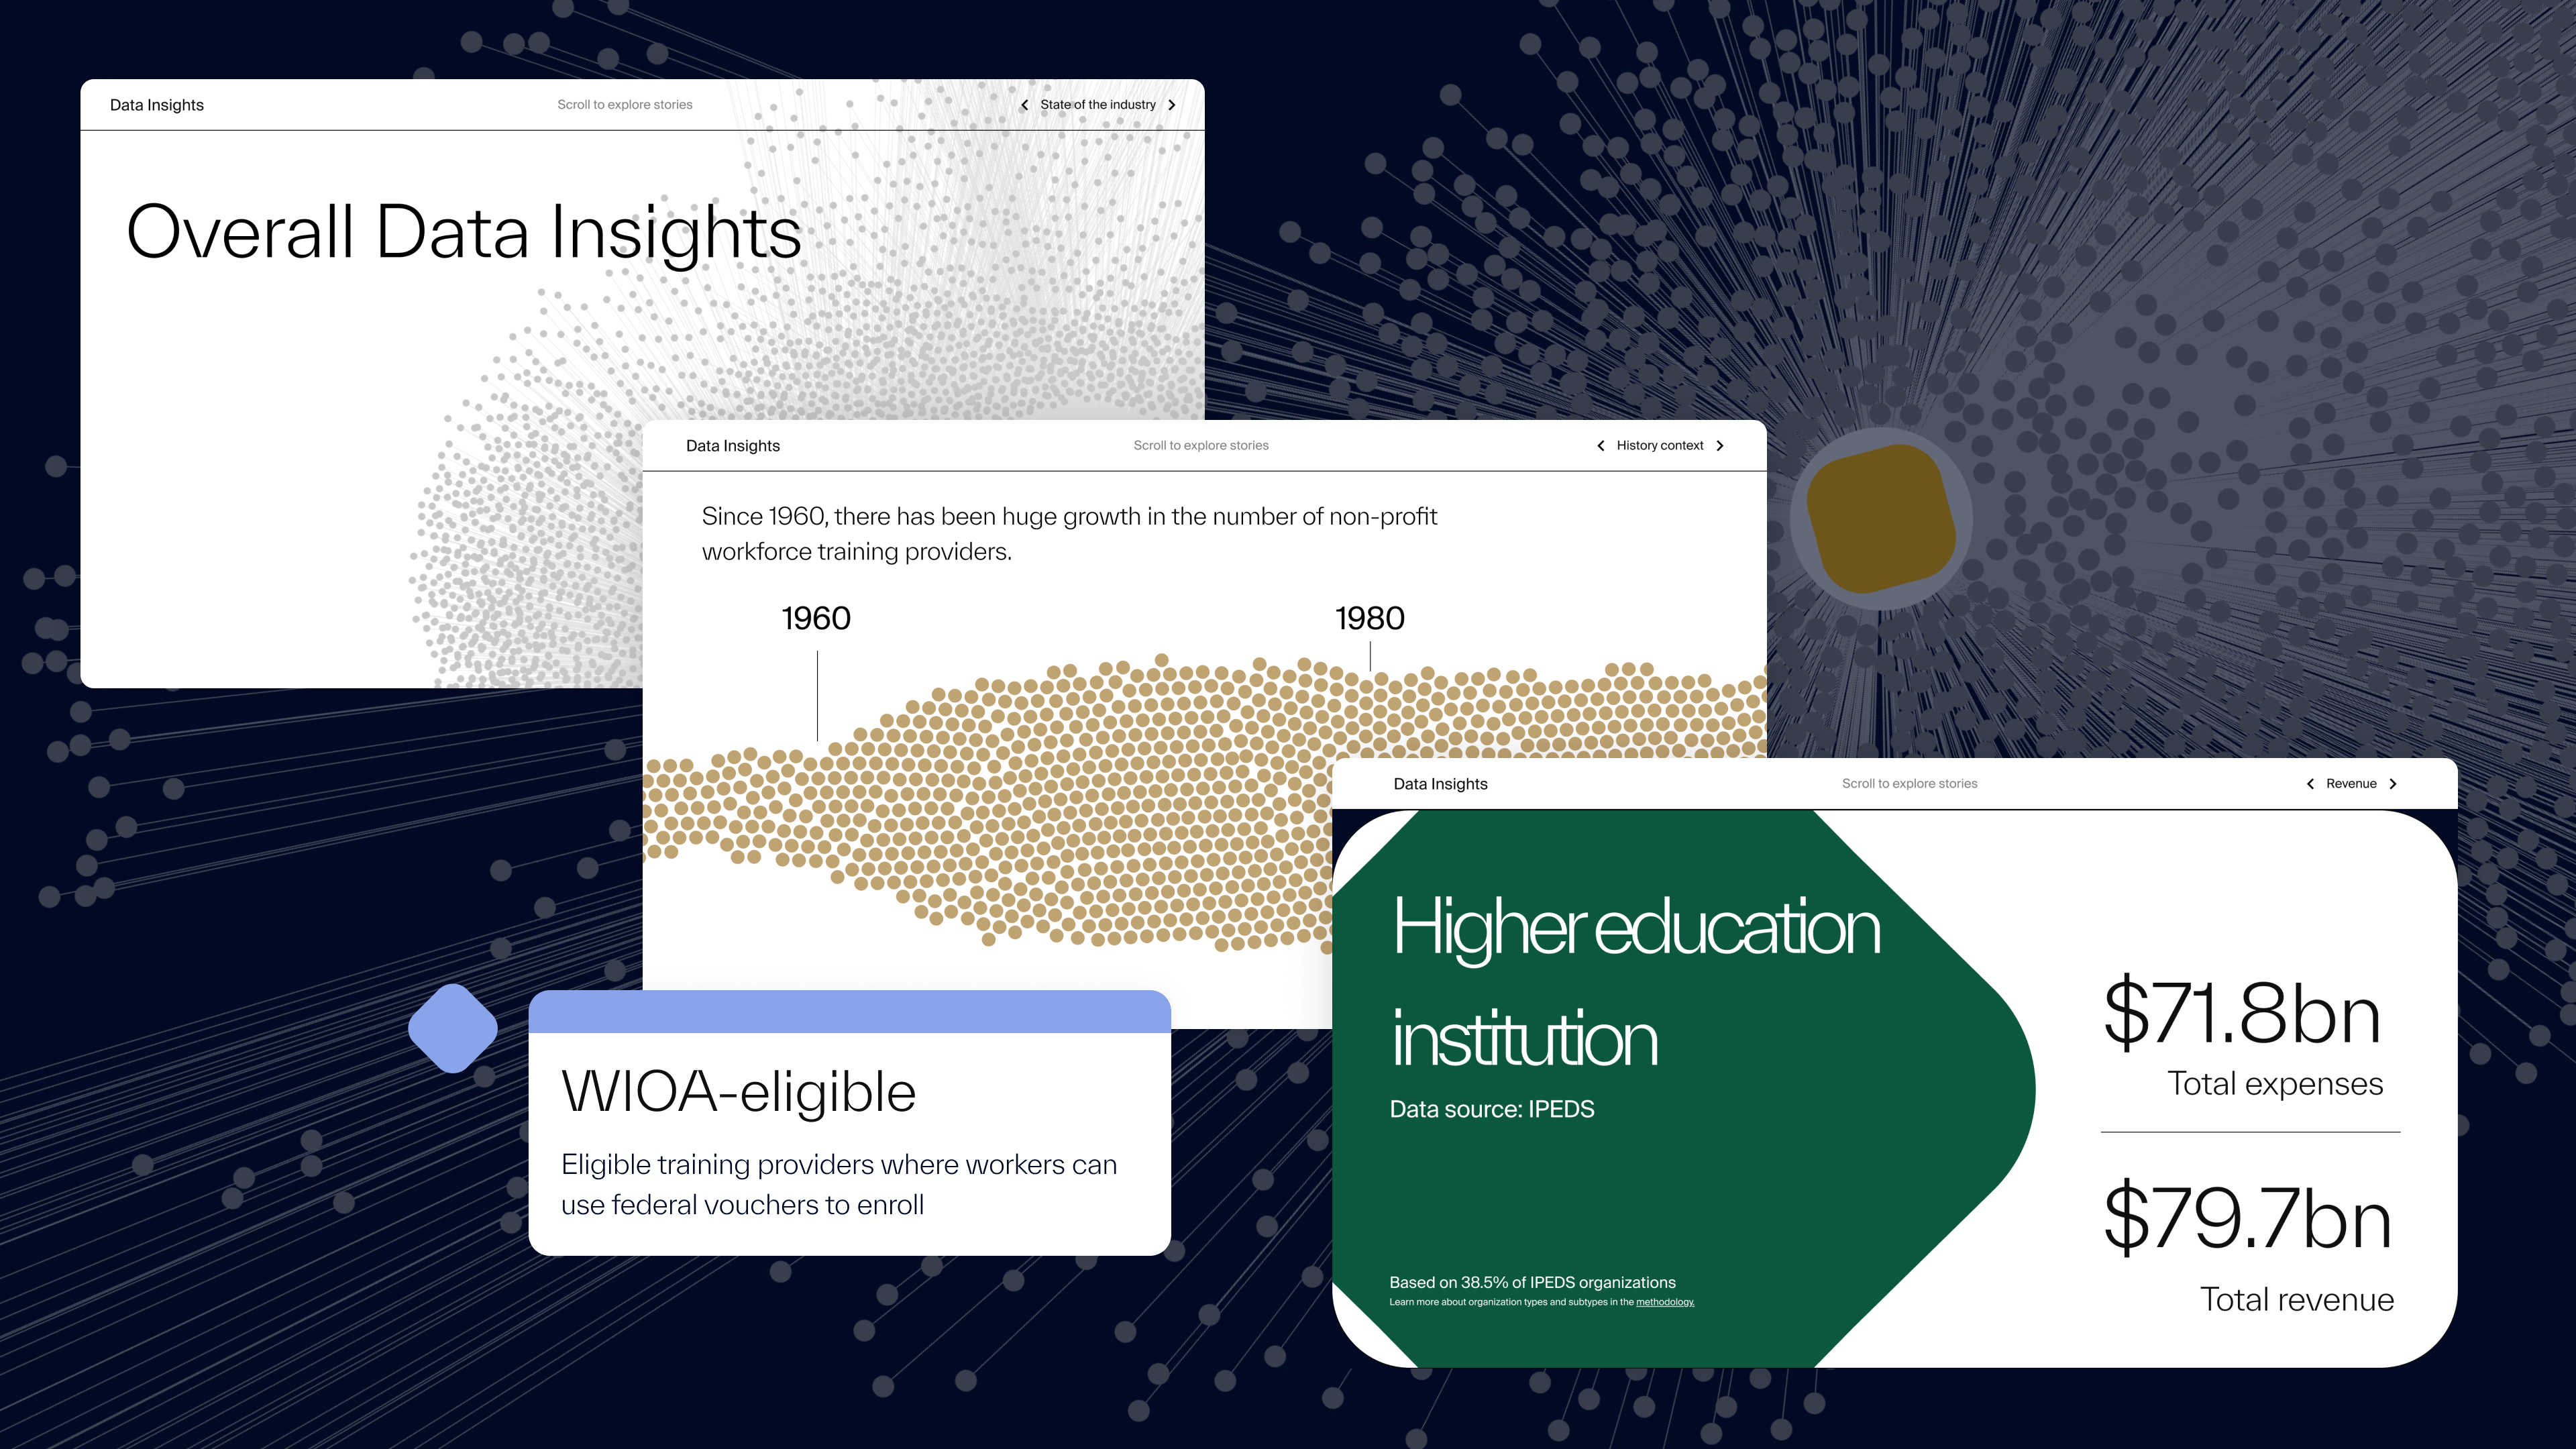
A central challenge to creating a system-wide view of the workforce training sector was that the data and its analysis would often sit in siloes. Each of the Workforce Almanac’s four data sources groups training organisations into subcategories, but each does so differently and according to its own system. These native systems do not match up.
To overcome this issue, the Harvard team created a new classification system of 14 subtypes that cuts across all four sources. Individual organisations are then allocated to these subtypes in the dataset, before being classified in an interactive visualisation to show the volume and relationships shared.
This is the first iteration of the Workforce Almanac, so the focus has been on looking at breadth of coverage. In the future, we’ll be looking at mapping the depth – the quality of worker education outcomes – so that the portal can become even more practical and worker-centric.