Maximising the value of EHR data for improved clinical outcomes
Reading time
Category
Our first Future Fridays theme for Healthcare was to try and tackle one of the biggest challenges in medicine today: how to take full advantage of incredibly complex and huge reservoirs of clinical data to extrapolate insights and ultimately improve clinical outcomes.
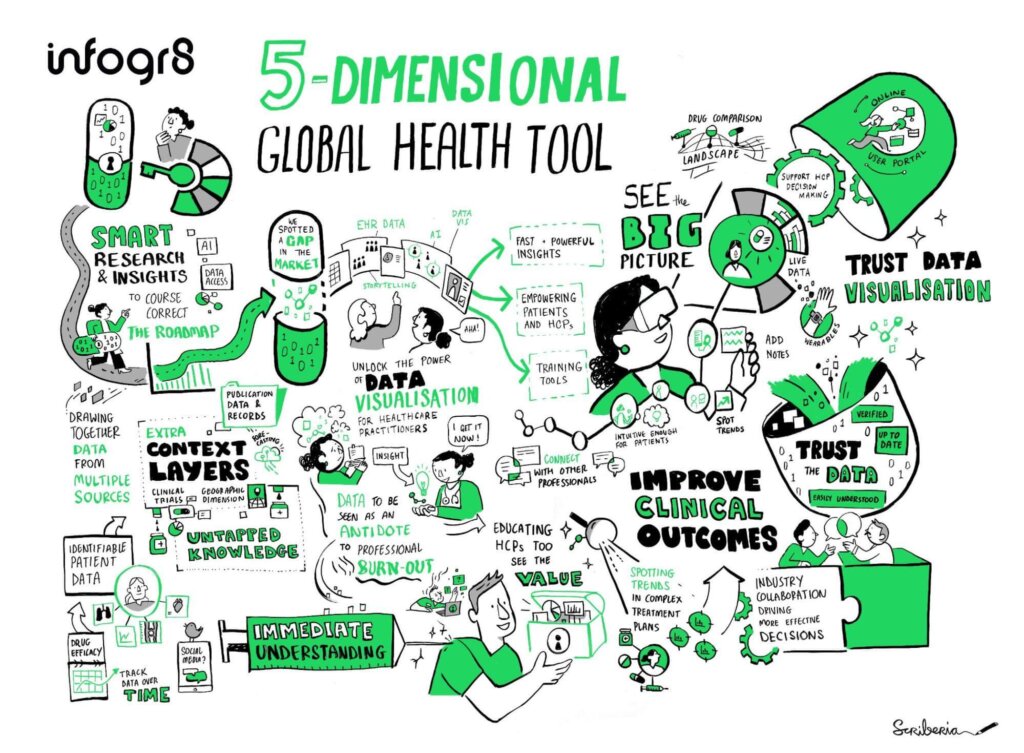
Introducing infogr8’s 5-D Global Health Tool
Background
EHR (electronic health records) have exploded in popularity in the last two decades. Dedicated national health EHR systems like CPRD and HES have been created in the UK (NHS), while private company EPIC currently handles 70% of all patient data in the US.
Early on, the adoption of EHR systems was met with antipathy by HCPs (health care providers) due to the additional workload it created, with little to no observable benefits at the point of care. In fact, some studies were showing that EHR systems were leading to HCP burnout.
In those early days, it wasn’t really fully explained to the average HCP what the immediate or long-term benefits of EHR adoption was. Personally, I wouldn’t be surprised that, at the time, not even the hospital/healthcare systems could have foreseen the future potential of EHR to improve clinical outcomes through AI algorithms, stratifying patients through retrospective analysis of these gargantuan data sets.
Today, the benefits of EHR systems are clear, due to advancements in technology and adoption of AI in EHR data analysis. I’ve personally worked on a number of EHR AI projects that have measurably contributed to improved clinical outcomes, from improved diagnosis of ultra-rare diseases to identifying patients at higher risk of life-threatening adverse events for novel gene therapies.
I’m also acutely aware that there are HCPs out there, far more qualified than I am, that are excluded from conducting this exact same work due to deficiencies and lack of consideration for the average HCP in existing EHR systems. The analysis of EHR data is still unfortunately the provision of a small minority, from hospital EHR managers to researchers to an even smaller groups of AI experts.
So the problem remains: How can we unlock the full potential of millions of HCPs by providing them with the tools needed to access, understand and extract actionable insights to improve clinical outcomes for their patients? Or put another way, how can we mobilise the wasted brain power of millions of HCPs to massively and positively contribute to EHR research – for the benefit of everyone?
Discovery phase
In early May, the infogr8 team travelled to London to meet our partners Scriberia for a full-day ideation and discovery session. The plan was to map out what the vision for our HCP-centric EHR data visualisation solution would be.
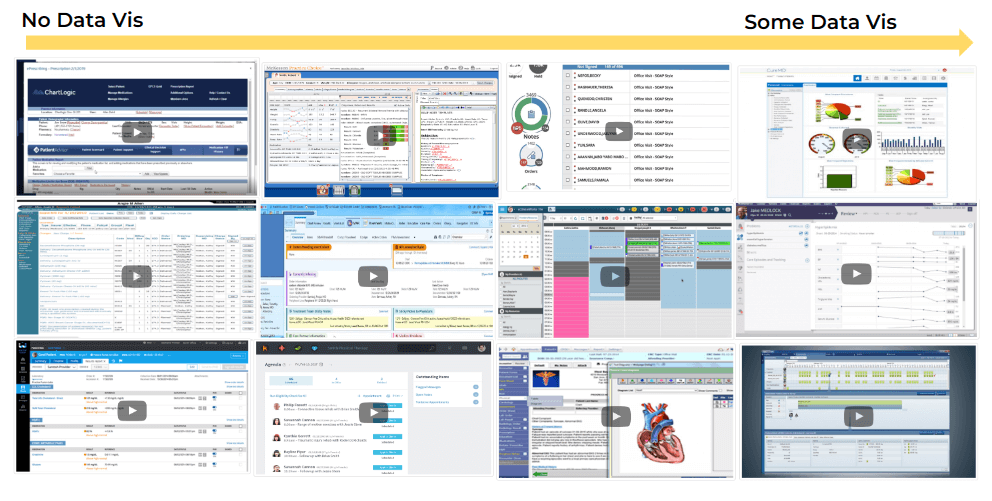
The next step was to benchmark the tool against existing EHR solutions to see what the functionality of the tool would be.
It quickly became apparent that the user interface of existing EHR interfaces was time-consuming, overly complex, and not intuitive. The UI also failed to deliver that “aha” moment, something that we were sure we could provide for users of our 5D Health Tool.
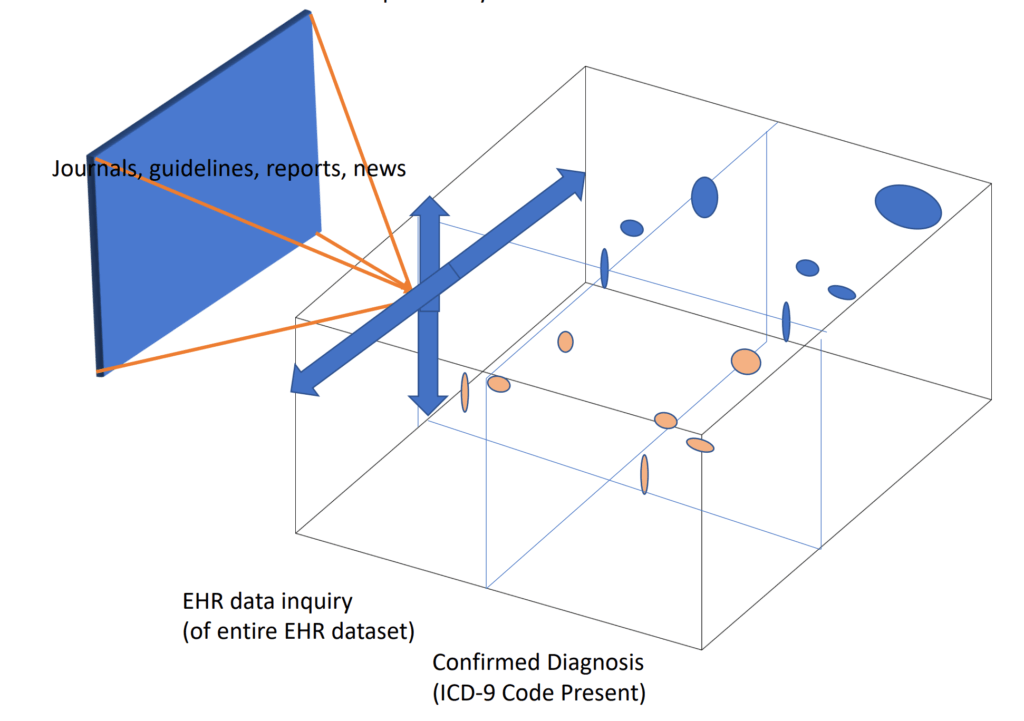
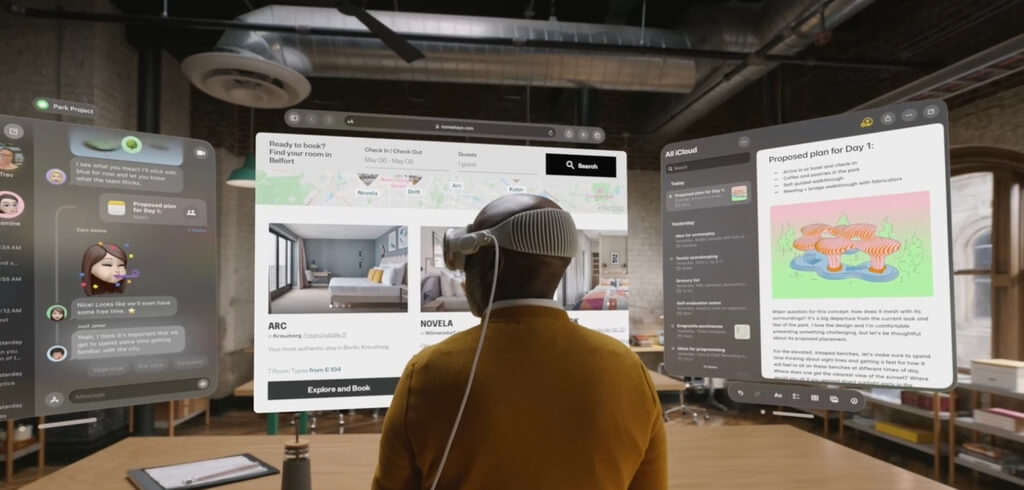
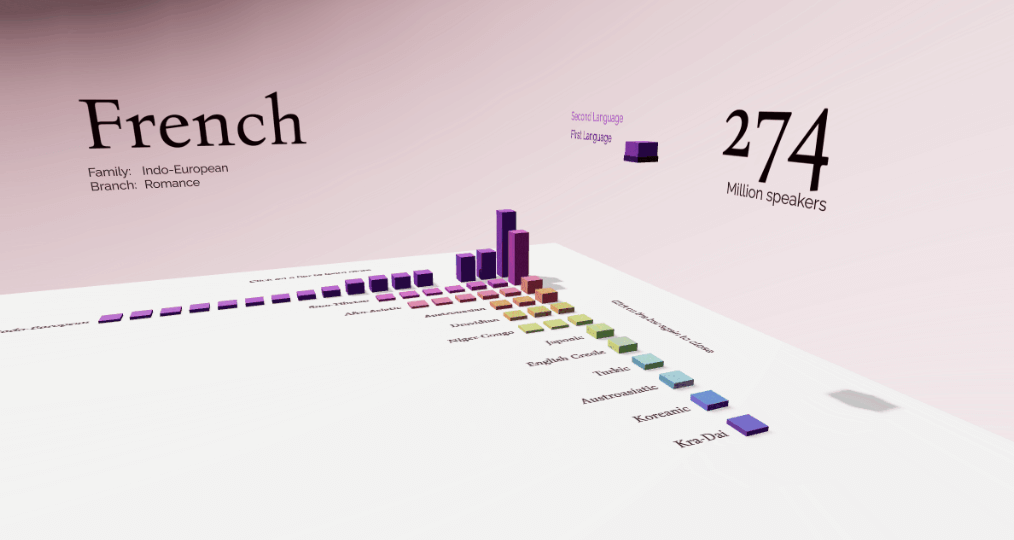
To bring the first ideas to life, the infogr8 team conducted a one-day sprint to delve deeper into how the tool could solve this issue. The resulting first sketches, settling on a 3D model, possibly delivered through AR/VR headsets, would allow HCPs to visually extrapolate insights across multiple data points – something a 2D visualisation would struggle to do with such ease.
With 3D visualisation, an HCP would now have the ability to compare patients within their EHR system and benchmark them against the wider population for multiple criteria simultaneously. This would include, for example, number of hospital visits or higher prescription costs (both indicators of uncontrolled disease) against a number of physiological data points (such as changing blood test results over time).
Once the HCP identifies the patients who require actions (booking a consultation, ordering tests, switching therapies, etc.), they would be able to utilise the 5D element of the Global Health Tool, which could include automating next steps as listed above (as existing EHR systems can do), while also offering additional levels of HCP support. This could include, for example, opening up search windows to recent publications and guidelines, or signposting to accredited education, lists and locations of recruiting clinical trials, and more.
Define phase
To add credibility and realism, we also decided early on in the discovery phase that the data used would ideally come from real-world examples.
To test the feasibility of this, I reached out to a former colleague, Tony Cox, an expert in EHR data analysis, with whom I had worked on previous AI stratification projects. To my delight, Tony was not only interested, but sharing our vision for the tool, offered to contribute some real-world (anonymised) data to the project.
Having weighed up our options, we settled on data collected from the deployment of an algorithm trained by AI to stratify patients at high risk of uncontrolled epilepsy. By including real-world data into the proof of concept, we would not only add credibility and realism but also demonstrate that any future real-world tool could (or in reality, should) integrate AI stratification capabilities – something we had already hoped to include, if feasible, all the way back to the first initial ideation session with Scriberia.
Now that we had a good idea of how the tool was going to function (and laser-focused on the value it was delivering), the next step was to find the right expert to bring the concept to life.
We ultimately decided that Stefan Pullen would fit the bill for this project perfectly. With a background in neuroscience and an excellent portfolio of data visualisations, we felt safe in the knowledge that Stefan would be able to take the epilepsy data and create a prototype that would tell the story best to time-poor HCPs.
Delivery phase
Ambitious in scope, we launched the final proof of concept in autumn 2023.
If you would like to send ideas or feedback, please feel free to email me.