How creativity can bring data and non-data teams together
Reading time
Category
Design teams and creatives have come a long way in the last 10 years. Here in the UK, there has been a 14.1% increase in creative roles in 2019-2022 alone, and creative thinking has been championed as an essential skill of the future. Last year, the UK government set out its vision for growing the creative sector by one million jobs and £50 billion by the year 2030.
Despite this, in my various career roles as an Environmental Consultant, Data Analyst, Head of Design and Product Strategist, I’ve often felt obstructed or undervalued initially as ‘someone who makes things look pretty’. I’m sure many in our field have experienced this uphill battle to change perceptions and show how ‘making things pretty’ is so much more than that – it can solve the biggest problems, add a whole lot of value, and even change a business completely.
While my role has sidestepped recently from designer to strategist, I still draw on my creative skills daily, and as our Sustainability pod at infogr8 grows, I can reflect on what things have worked (and not worked) when building creative teams and interacting with other teams within an organisation.
I could ramble on for days on this topic, but I’ve tried to condense my reflections into three key areas:
1. Understanding each other’s value
2. Bringing teams together
3. Designing within the company workflow
Let’s take a closer look at each one in turn.
1. Understanding each other’s value
The value of the data design role
I’m sure this is nothing new to most of you, but the first challenge I’ve always faced in many roles, particularly in data visualisation, is the perceived value that others place on what design or data viz have to offer. After all, you’re the person who makes the presentations look pretty, chooses the right colours for the bar charts and makes it look less Powerpoint-y, right?
Example: As a designer working on a new product, I was once questioned by the sales team about why I wanted to discuss purpose and strategy – the insinuation being that my remit was surely just colour palettes and font and that I didn’t need to worry about the rest… Or when wanting to create guidelines for chart uses and a style that best reflected the data, the status quo was to pick what fits the space and the colours that seemed the nicest next to each other….
I’ve tended to tackle this perception problem from two sides. First, there’s the need to provide knowledge about what design and data visualisation is from my perspective. Second, there’s the need to tailor my narrative and language to the skills and interests of the person I’m talking to.
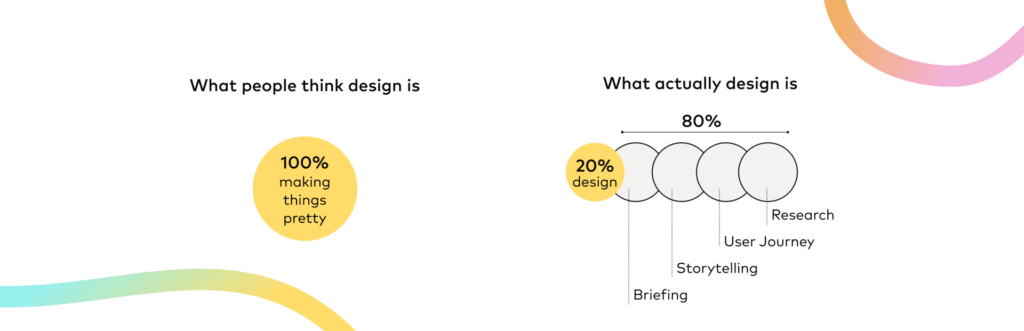
For the knowledge aspect, I’d explain that in any given design-related project, I would use only around 20% of my time actually designing. The other 80% would be spent talking to the team member who was requesting the design output to understand what the purpose was, what data they have and what it shows, and what their audience should learn from it. I’d also interrogate the data or information itself, restructure it, map it into categories or themes, and try to uncover the best approach to visualising it.
I would often find starting with the data aspect gave common ground to talk about something that both parties understood. This way, we could talk about its meaning and importance before getting into the visualisation, colour and format aspects that were often more daunting to others.
In essence, then, I’d explain to my peers that the designer’s job starts with thinking about the same key questions we all should think about as a team, whether you’re a researcher, a journalist, a data analyst or a consultant. We all start from the same point (the data and the story), and all our roles should work towards the same endpoint. We just have different methods to get there.
Returning to the second point, tailoring to the person we’re talking to means we need to be empathetic. As a reminder, empathy refers to the ability to view other people’s perspectives, and to understand what’s important to them and what their experiences are. So find your inner chameleon, listen and adapt, and communicate your points but through their lens. For example, if I’m talking to someone from sales, I need to talk about efficiency, benefits, and new opportunities. If I’m talking to someone senior, I need to be concise and direct, and avoid using lots of design jargon.
The value of the individual
Now we’ve clarified the value of design, the next and perhaps most important thing is to understand our value as individuals.
I think it’s fair to say that it can be quite rare nowadays to find people 30 years into a career where they’ve really only experienced one role. (Our EdTech pod’s Career Pathways tools are testament to this.) Many of my peers have entered their current position via an indirect path, and I myself have led a rather multidisciplinary career path, too. I’ve known data analysts who used to study rocket science or geology, researchers who used to be teachers, and designers who used to work in biomedicine. Consultants in particular can come from every different career path you can think of.
My point? Often, people make initial judgments about your understanding or skills based on that one current job title – not taking into account the X number of years as a data analyst, the Y years as a scientist, and all the tacit skills gained from each individual life experience along the way.
Some examples of audience design:
Sales teams – I would often create a pitch deck to keep my ideas framed around opportunities, benefits, efficiency, new sales packages, and so on. If I only spoke about design best practice, they would often just switch off.
C-suite – Given that the C-suite are often short on time (and attention span), I would create 3-5 concise slides that quickly showed what I was wanting to do. I’d also keep the dialogue succinct and frame the language I used around what I knew was important to them.
Researchers – I would initially take on a project management role to help them manage workload and feel happier about adding designs to it. I would then keep the discussion technical and around their own work and what they wanted to achieve (I would then figure out the rest). For those who were keen, I would mentor them to make simple designs themselves.
A designer can also be good with data (indeed, we have a whole field of dedicated data visualisation designers), and they can also have an entrepreneurial mind. A data scientist can also be creative and have a product mindset. We need to be more forthcoming with this realisation to be able to communicate, collaborate and innovate together more effectively in the future. This is especially true given that we’re living in this new age of digital transformation and innovation, where blended roles and skill sets will become less like the mythical unicorns of talent management and more of a necessity for teams and organisations to thrive.
Value works both ways
So far, this has been pretty one-sided through the lens of design and data professionals. The other person in the conversation is equally important. We also need to understand others outside our typical role – what their skills are, and their needs, wants and challenges in their roles – to be able to really communicate properly and proactively problem-solve together.
Example: We need to understand the perspectives of the key departments within the company (C-suite, account dev, sales/marketing, developers, project managers, etc.) if we are to empathise with their point of view and find that point of common, intersectional understanding where the solutions lie.
One thing I often find is that once people understand what design is about, they often defer to the position of ‘well I’m not creative, I can’t draw anything’. This happens all the time: I’ve heard people refer to design as magic when it really just comes down to a lack of understanding.
People assume that creativity is mostly about the doing, but it’s not. As a good manager or designer, when you break a project down into key questions (including the why) and get everyone coming up with ideas, then you’ll find that everyone can contribute in some way. It’s about giving them the confidence that creativity isn’t just the reserve of your school art class. (I may be able to paint you a detailed watercolour landscape, but at that family Pictionary party when everyone assumes they want me on their team, I can barely doodle a stickman.)
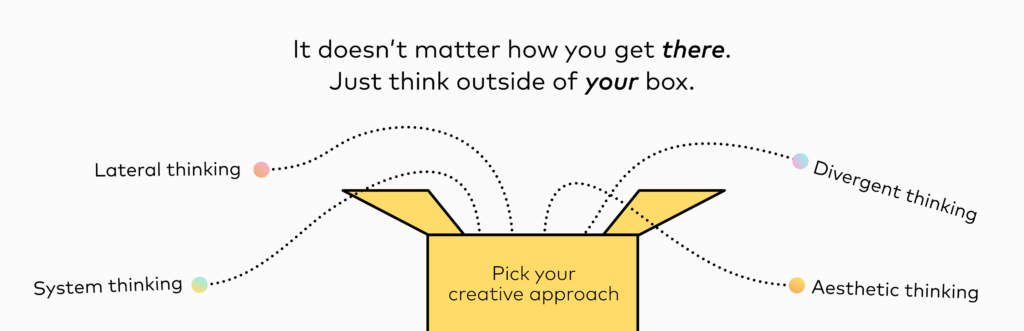
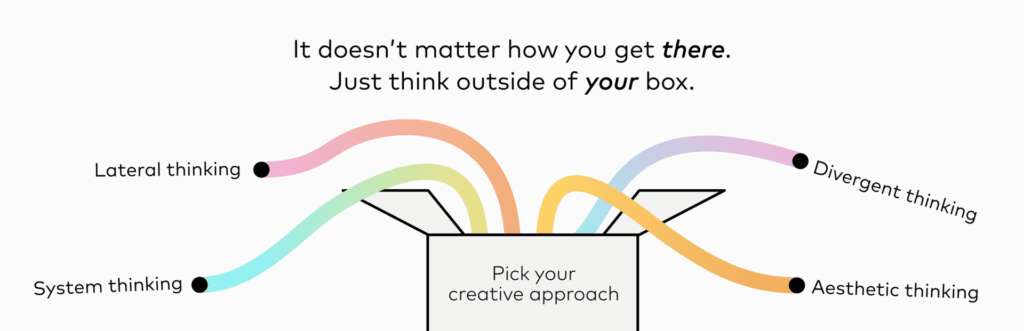
Creative thinking can take many forms. You can be a problem-solver, an adept communicator, an analytical mind; perhaps you’re able to see systems and the way they work, meaning you can work laterally.
Take architecture: the architect who uses figures, design and analytical thinking to draw the building plans may not necessarily have the skills to build the home themselves. Vice versa, the bricklayer may not be able to visualise or calculate the designs. But where they both need to problem-solve and think innovatively to adapt to challenges, they are both creative thinkers in different ways.
For those sitting in design or creative roles, we need to help everyone find their creativity in whatever form it may be and make them part of our journey.
2. Bringing teams together
Moving on to the second phase, once we’ve got to understand each other, we have to unite teams across an organisation.
I’ve worked in many places that struggled with siloed working, and for many different reasons. Content gets created without discussing it with the marketing team. New projects are won without asking the analysts or the developers how long it will take (or if it’s even possible). Designers get asked to chuck some images together without ever discussing the data or its purpose.
I’ve often spent a good chunk of my time asking questions, listening and talking to people across departments and in various positions to understand from the get-go whether there were any challenges preventing us from achieving empowering solutions across the company.
A few conversations later, and it’s often apparent where this is. It could simply be the wrong people, in the wrong room, at the wrong time, or that there are no regular meetings to ensure active discussion. Or it could be a need for good project management to manage stressors, or simply a lack of understanding that something wasn’t working in the first place because a perspective had not previously been heard.
These conversations can be difficult, but I’ve seen the benefits far exceed those initial difficult few months needed to align people, project and purpose, all with a generally improved sense of positivity. Committing to a dedicated meeting or meetings regularly is a great start, as is using a single source of truth for tools to track tasks and collaborate together, along with a timeline that balances the priorities of the different departments involved.
You might be asking “What has this got to do with design or data?” Well, it’s not always the case, but in my experience it’s been the innovative and data-led projects that kickstarted the need to join up teams and really shine a light on the flaws of siloed working.
Once you and your teams have found an approach that works, you then have to make it a habit. And we all know that making things a habit takes time and commitment, and sometimes a motivated individual to lead the way.
Done right, this type of structured approach actually enables flexibility and empowers individuals and teams to do what they do best. Like a recipe, they’re more like guidelines: they give everyone the same start, middle and end points, the same number of steps so we’re all aiming for the same output, but if we wanted to use tofu instead of chicken, or add a little more chilli and hold the mushrooms, as long as we communicate together and have purpose for those decisions, then we absolutely can.
3. Designing within the company workflow
Right, now we understand each other, we’ve started to talk and plan together and have identified where the challenges lie. How do we make solutions happen?
When it comes to workflow, we need to ask four core questions:
Why do we design?
Why, why, why indeed. Whenever a design task or project is brought up, we should get all the key stakeholders in a room (physical or virtual) to agree on the purpose of why we are researching, doing, designing, etc. Is whatever we’re doing purposeful? After all, we don’t want to get 10 hours into a design and find in our first review that everyone is wanting different things for different reasons (and the expectation for this graphic to suddenly explain the meaning of the universe to every living soul on the planet while it also sings you a song and does a nice tap dance).
One thing I’ve often noticed as a key challenge is that the requesters (not always but often in very senior roles) present the designers (and other roles) with the solution (e.g. ‘I want you to redesign this for me in green, add a new logo and change this number’).
Anyone spotted the problem? At this point, we don’t know any of the why, and this means that from the outset we’re hampered from creating the true solution needed for success.
How to design?
So, are there ways we can design to solve these problems? Yes, there are many ways to approach design. At infogr8, we follow the British Design Council approach of Discover, Define, Development, Deliver.
A design thinking lens provides flexible and purposeful guidelines for individuals and teams to apply to most situations. When working with data visualisation, we need to ensure that the data is also considered from the start and throughout. After all, you can’t design solutions without also understanding the data, and that data is rarely clean, structured, mapped or categorised in a ready-to-go way.
Design thinking is structured around six key steps, each helping to tackle a key challenge:
1. Empathise
As I mentioned previously, too often we’re presented with the solution needed rather than the why. And, more importantly, it’s not based on the opinion of the end-user. We need to understand the people we are designing for in order to create valuable solutions. So always start with people.
2. Define
In this stage, we focus on turning the observations we have learnt from our users into a clearly defined problem statement that we will focus on solving. This is crucially important especially when working in teams. After all, good solutions rarely come from one person saying ‘Go do this’ – they come from aligning a challenge in such a way that teams can use their curiosity and expertise to problem-solve collaboratively.
3. Ideate
Once we know who we are designing for and why, we can get the ideas flowing, look at what options might solve the problem, and provide feedback.
4. Prototype
The preferred ideas can be built as prototypes or low-fidelity versions to bring them to life, while again critiquing and requesting feedback to see which options do or don’t work.
5. Test
By this point, we will have refined down to one or two ideas that can be tested among a wider audience and in a real-world test scenario to further iterate and check the robustness of the solution.
6. Implement
Finally, after feedback from testing, we will have a solution ready to be used quickly, and likely ticking more of the boxes for our audience.
I think of it like a game of Guess Who. Eventually, with enough yes and no questions, we might need to go back and re-question our assumptions, but the answer (solution) will present itself clearly. However, without the instinct/opportunity to ask these questions, it becomes a game of guessing and trusting to luck. And when it comes to people’s time, effort and budget, we really need to be sure.
When to design?
In organisations with many departments and where design is not the sole output, the design element can often be an afterthought. As a result, designers may be asked to jump in at the end and work miracles with very little insight or time left on a deadline to do so.
In my experience in various companies, the design ‘team’ has initially been viewed as one person who is pretty much an alien to the rest of the business and who works on their own and only at the end of projects (and is therefore excluded from discussions, planning, weekly meetups, etc.). And the same can happen with other non-traditional roles.
As I mentioned earlier, designers ask the same questions that a researcher or analyst would, so they should also be involved at the start of any given project and looped in throughout, not just for the design benefit but to actually help the other team members. By having these early conversations to share perspective, it can be surprising how many good ideas pop up and how supportive it can be to work collaboratively.
Who designs?
Everyone.
Everyone is creative. Creativity isn’t imaginary; it’s a muscle you can train, and there is no one right path for how this is done and what form that takes.
The really successful designs within teams are those that in some way include everyone, reflect all the discussions and ideas, empower people to feel confident in their work, and bring out the best in the company as a whole.
Some future-gazing
So what will be different when looking at future data design teams and the skills we need?
Perhaps not much really. Yes, technology may cause a rapid learning curve that presents us all with a little uncertainty about how teams may work together in the future. But at its heart, I believe that successful teams all require the same five tacit skills.
The NFER say the most vital ‘essential employment skills’, anticipated to be most in-demand by employers in the future, are as follows:
1. Communication
2. Collaboration
3. Problem-solving
4. Organising, planning & prioritising work
5. Creative thinking
Creative thinking has also been singled out by Forbes as the most in-demand skill among 70% of employers in 2024.
These are all skills I’ve mentioned throughout this blog (I’ve had my highlighter out for emphasis) for understanding each other, seeing value, bringing teams together, and creating effective workflows. None of them are new skills, and they don’t require a qualification. Anyone can learn them, they are transferable across roles, and they can really set you up for success in a wide variety of exciting careers in design, data, project management and strategy.