Mapping Clerkenwell Clerkenwell Design Week
Challenge
How do you visualise the sources of inspiration of one of the leading creative communities in the world?
The reputation of Clerkenwell is no secret, over the years it has produced some of the world’s great creative minds, from Zaza Hadid to Charles Dickens. Every May, its design communities come together for the annual Clerkenwell Design Week – a celebration of everything that makes the area so unique.
Having been a resident of Clerkenwell for a number of years, infogr8 decided to join the party and contribute our effort in a way that was true to the creative spirit of the community and our own passion for beautiful data visualisations.
Solution
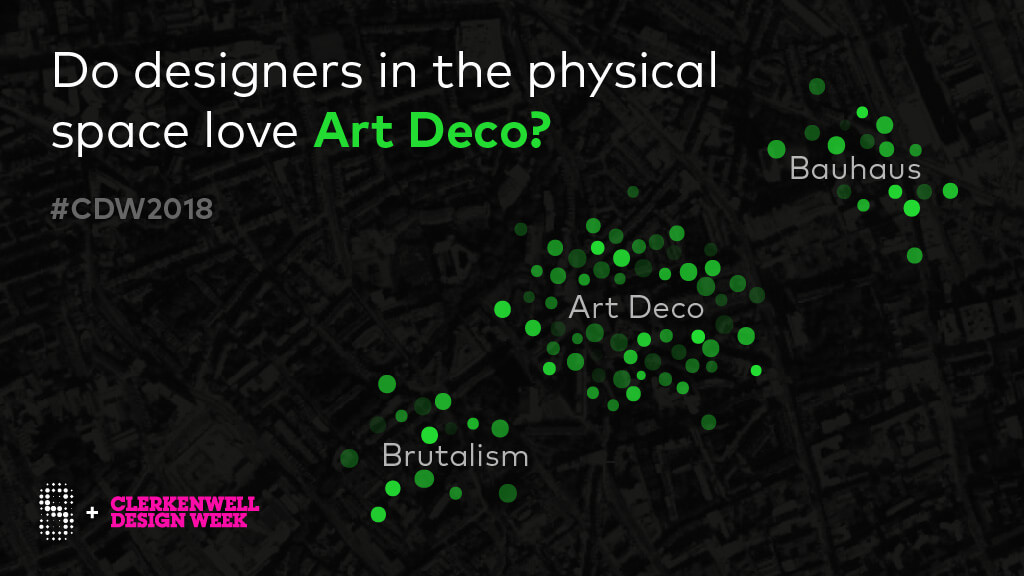
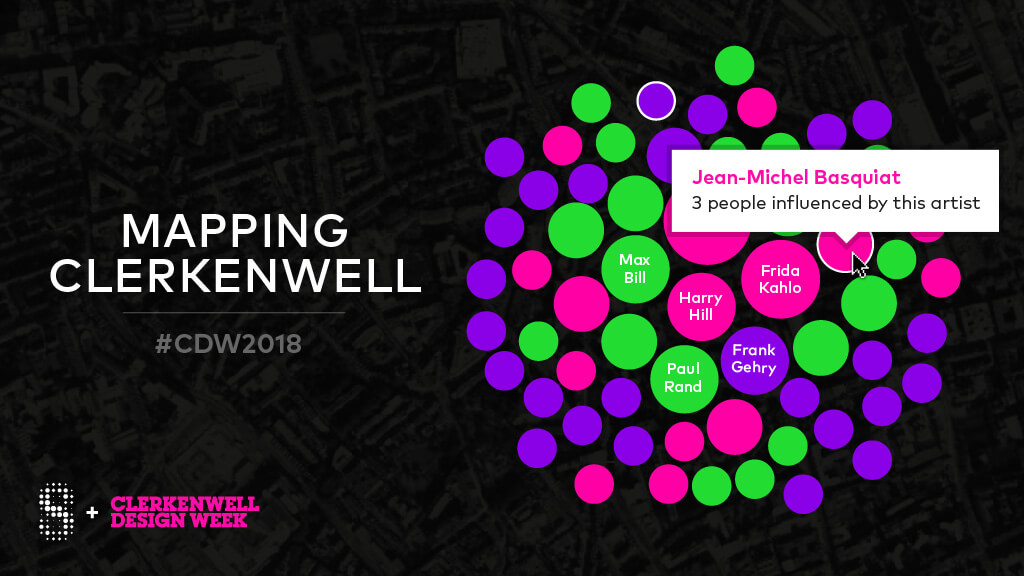
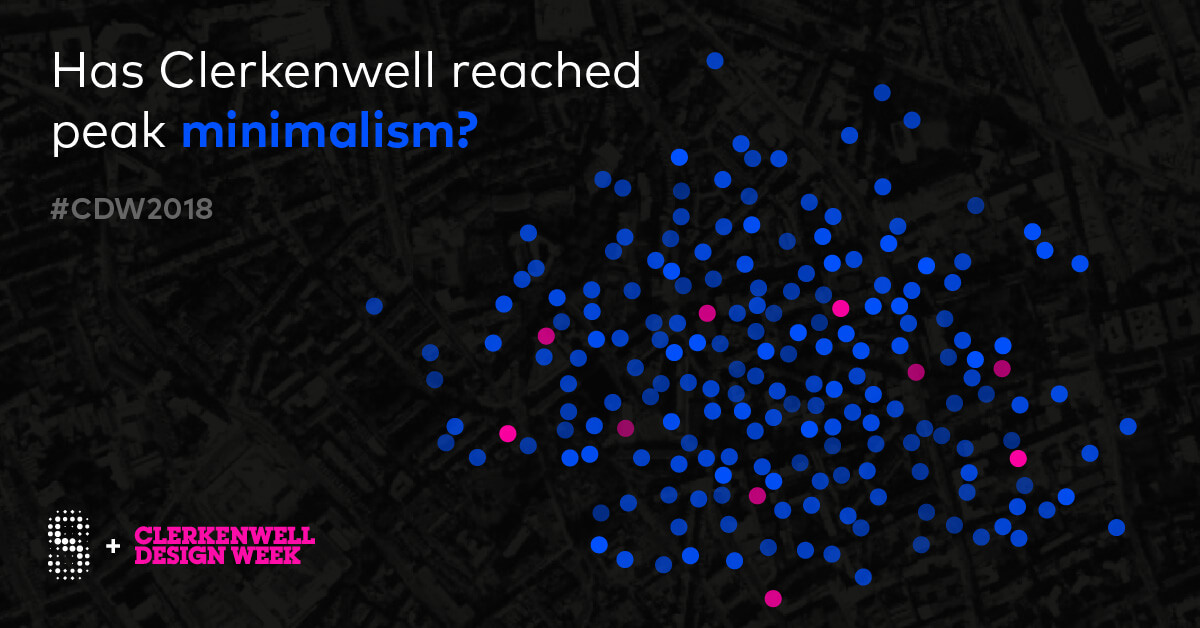
We conceptualised an interactive data visualisation where users were able to discover the patterns, trends and influences that inspire the creative communities within Clerkenwell, uncovering any connections and commonalities as they went.
As the week evolved, so too did the visualisation, with event attendees and the wider online community having the opportunity to enter their favourite design movements, inspiration and colour to the tool and become part of the story.
On an aesthetic level, it was imperative that the tool was sleek, simple and refined with a level of premium design thinking which was worthy of representing the creative reputation of Clerkenwell.
Results
The interactive tool was launched alongside the official opening of Clerkenwell Design Week, providing a never seen before insight into what inspires this local collective of industry leaders.
“Events like Clerkenwell Design Week are bound to attract people with shared interests, but it’s not clear at first glance where different communities, patterns and trends are situated. Data provides us with a zoomed in lens through which we can discover the connections that bring people together. As the week progresses, we’re excited to see how the visualisation might take shape and evolve.”


