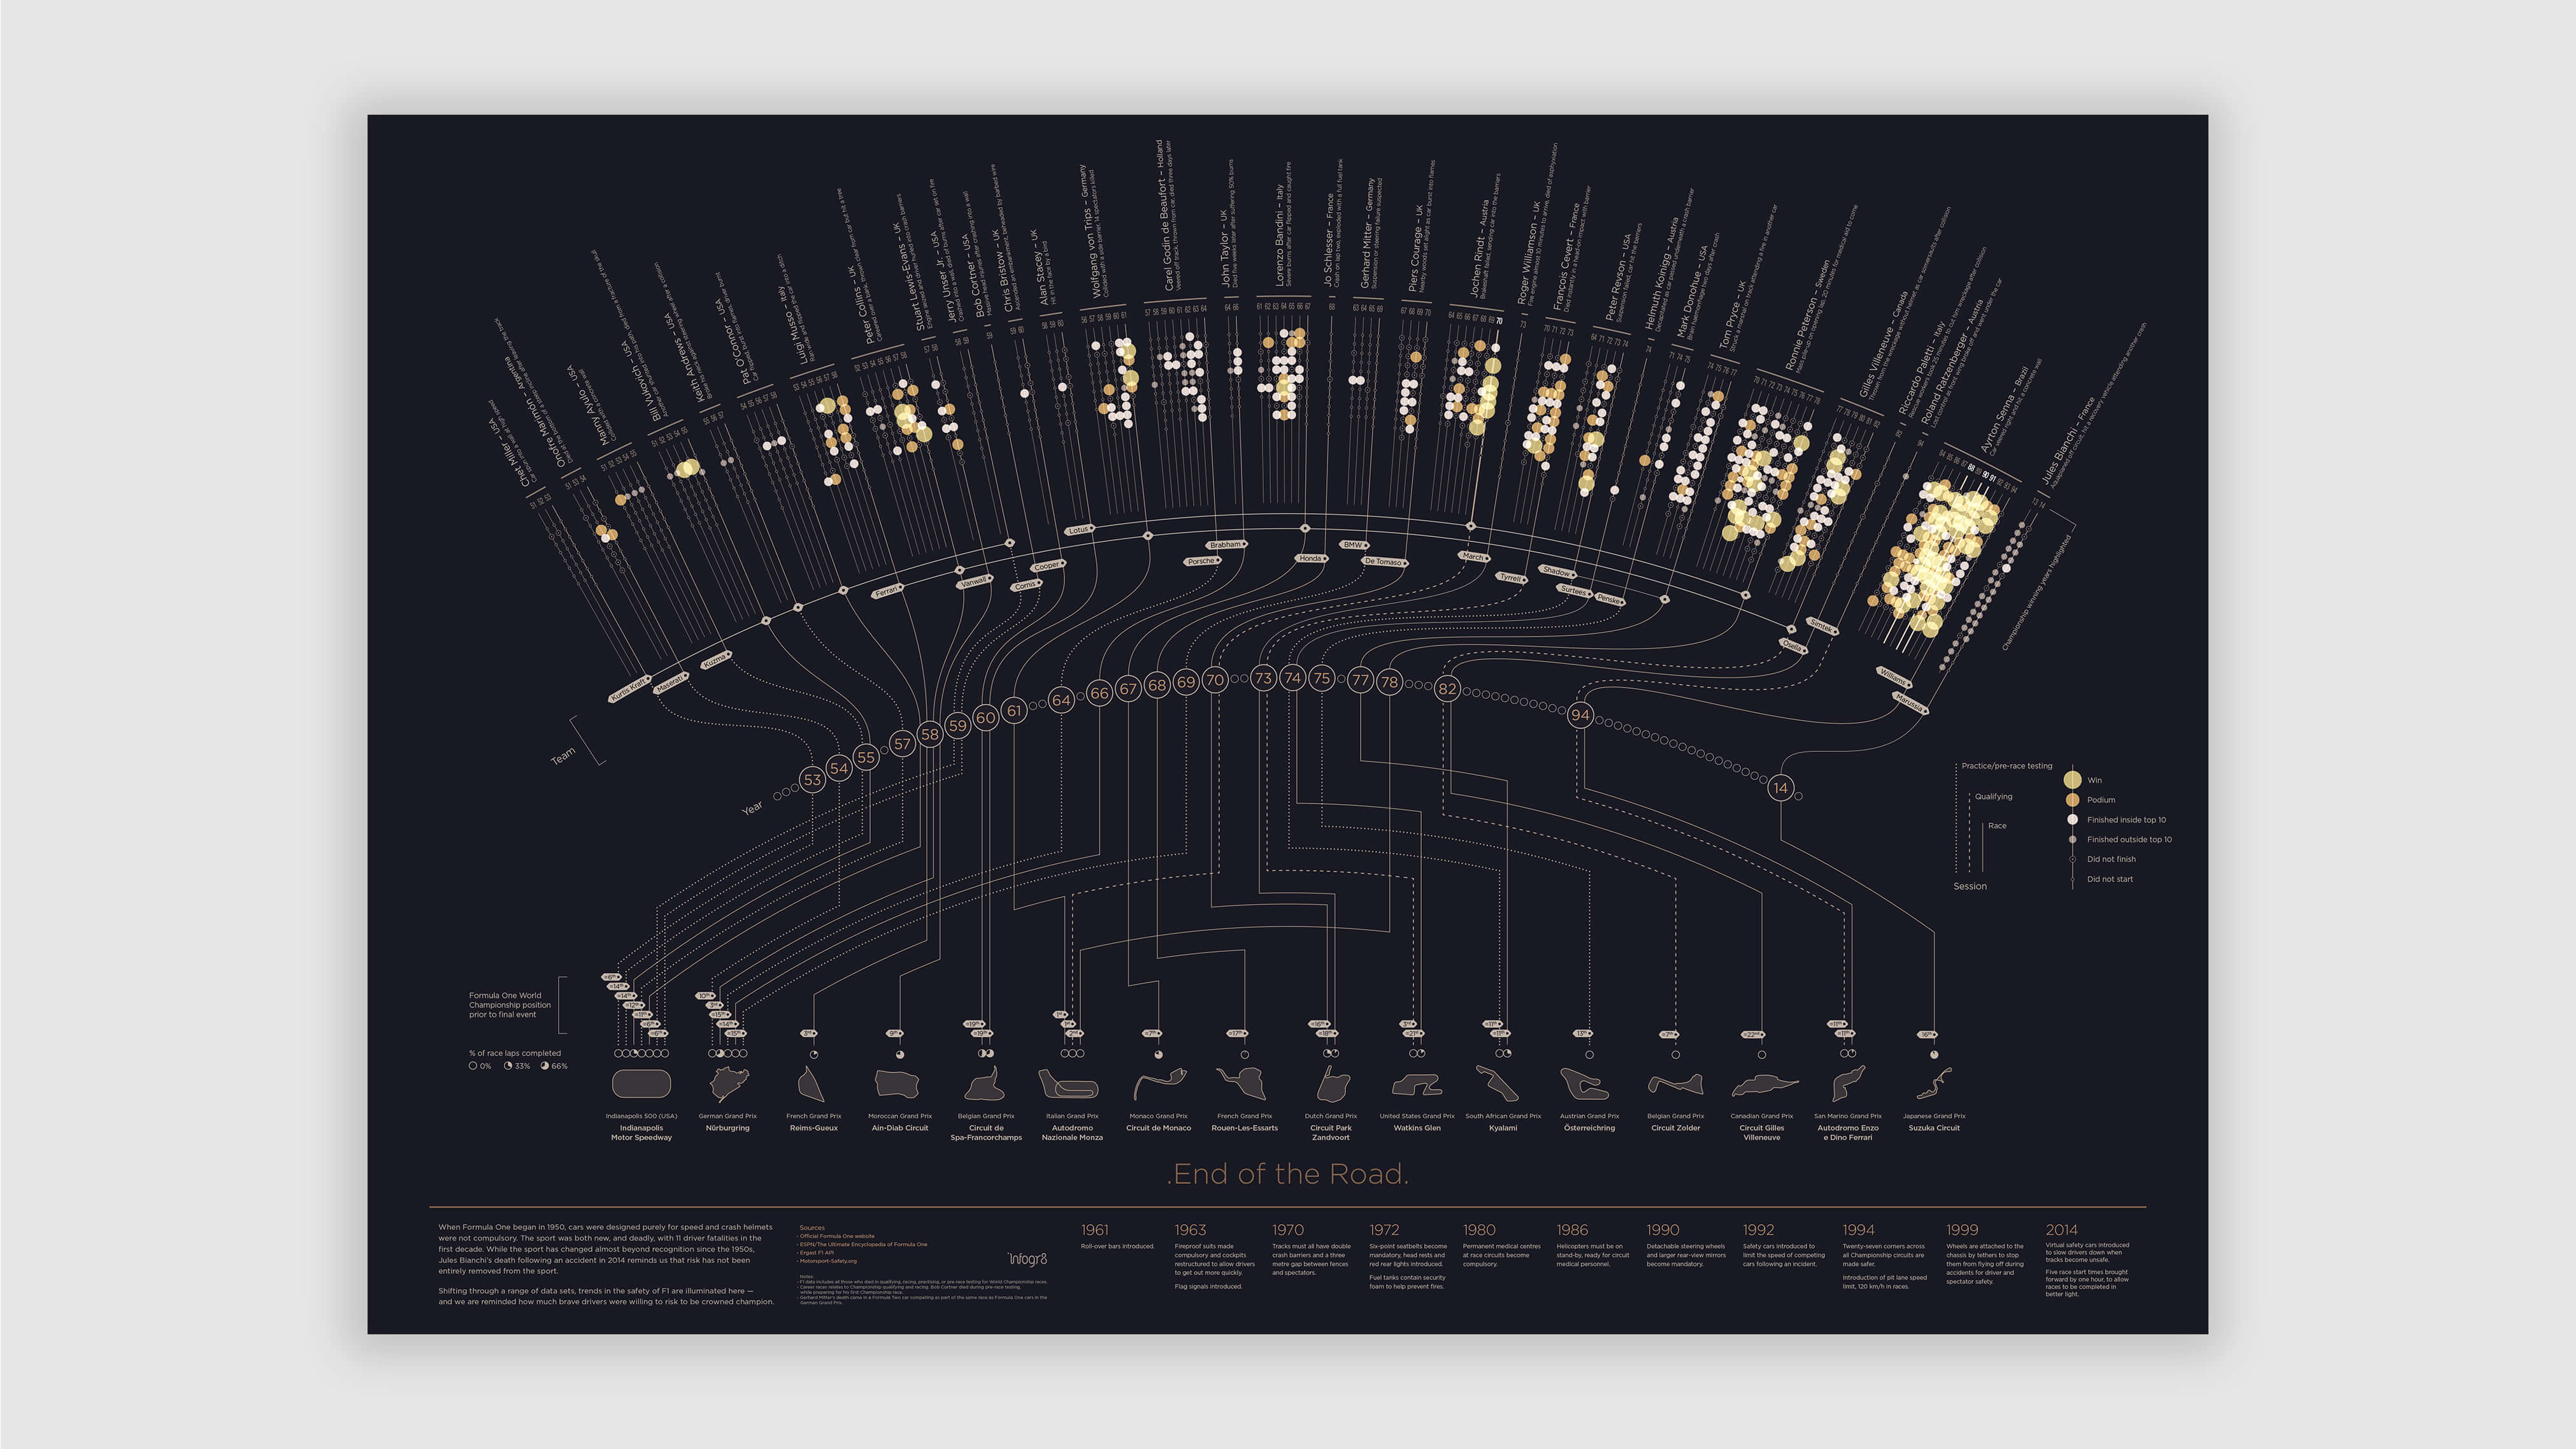
Data visualisation
Present quantitative data within a creative visualisation that your audience can enjoy engaging with
Benefits
-
A static asset where data is presented with a clear narrative
-
Allows the audience to rapidly identify trends across multiple data sets, rather than read through data laboriously
-
Can be a beautiful stand-alone art piece ideal for physical spaces, and a powerful hero piece to support other content

