Mars Petcare | End Pet Homelessness
Challenge
-
What do you do when your existing data outputs leave audiences with more questions than answers?
Mars Petcare came to us looking to bring data to life from their project looking into pet homelessness in three key areas: keeping pets in homes, preventing unwanted pets, and ensuring sustained care. As a key objective of the project was to share the data publicly to increase understanding of the issues impacting pet homelessness, it was crucial to maximise the potential of the data – including pioneering survey data from nearly 30,000 pet owners across 20 countries – to bolster understanding of this important societal challenge.
Solution
-
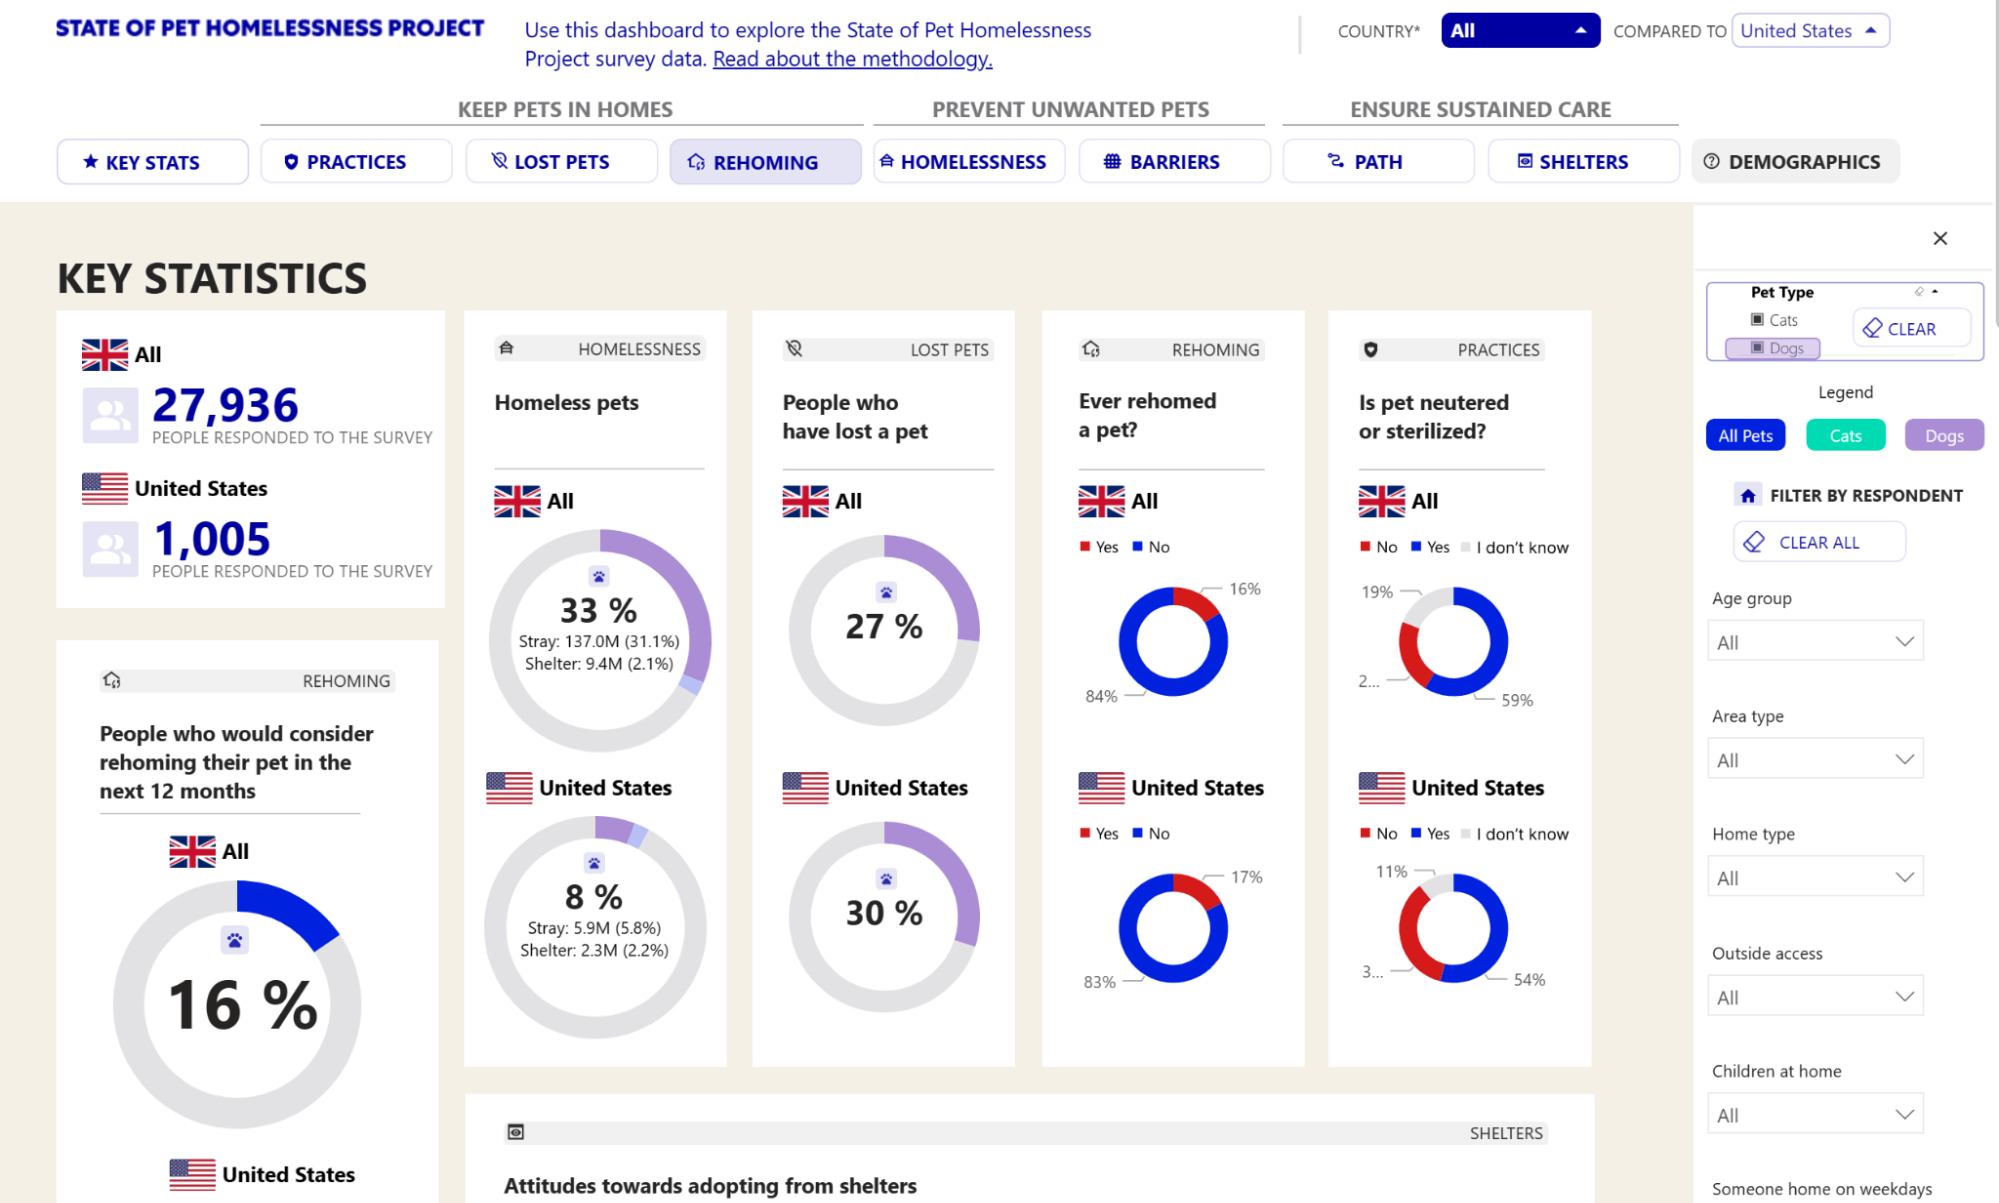
Bringing together a specialist team across data design, data journalism and dashboard development, infogr8 revitalised the State of Pet Homelessness Project website and created an interactive Power BI dashboard.
The dashboard pushes the boundaries of Power BI design away from the overly technical and towards something more engaging and accessible to a wider audience, with added functionality in the form of user-led filters and side-by-side comparisons.
Together, the new website and data dashboard support audiences to find and interact with the information most relevant to them, while giving Mars Petcare the flexibility to develop the platform further as the State of Pet Homelessness Project progresses.