CompTIA
Challenge
-
CompTIA wanted to create a definitive guide to national, state, and metropolitan area tech sector and tech workforce analytics.
With huge data sets on employment in the tech industry, there is a lot of potential to offer useful data-based insights. These insights also needed to be easy to navigate and contained in a platform that’s not intimidating to the user.
Solution
-
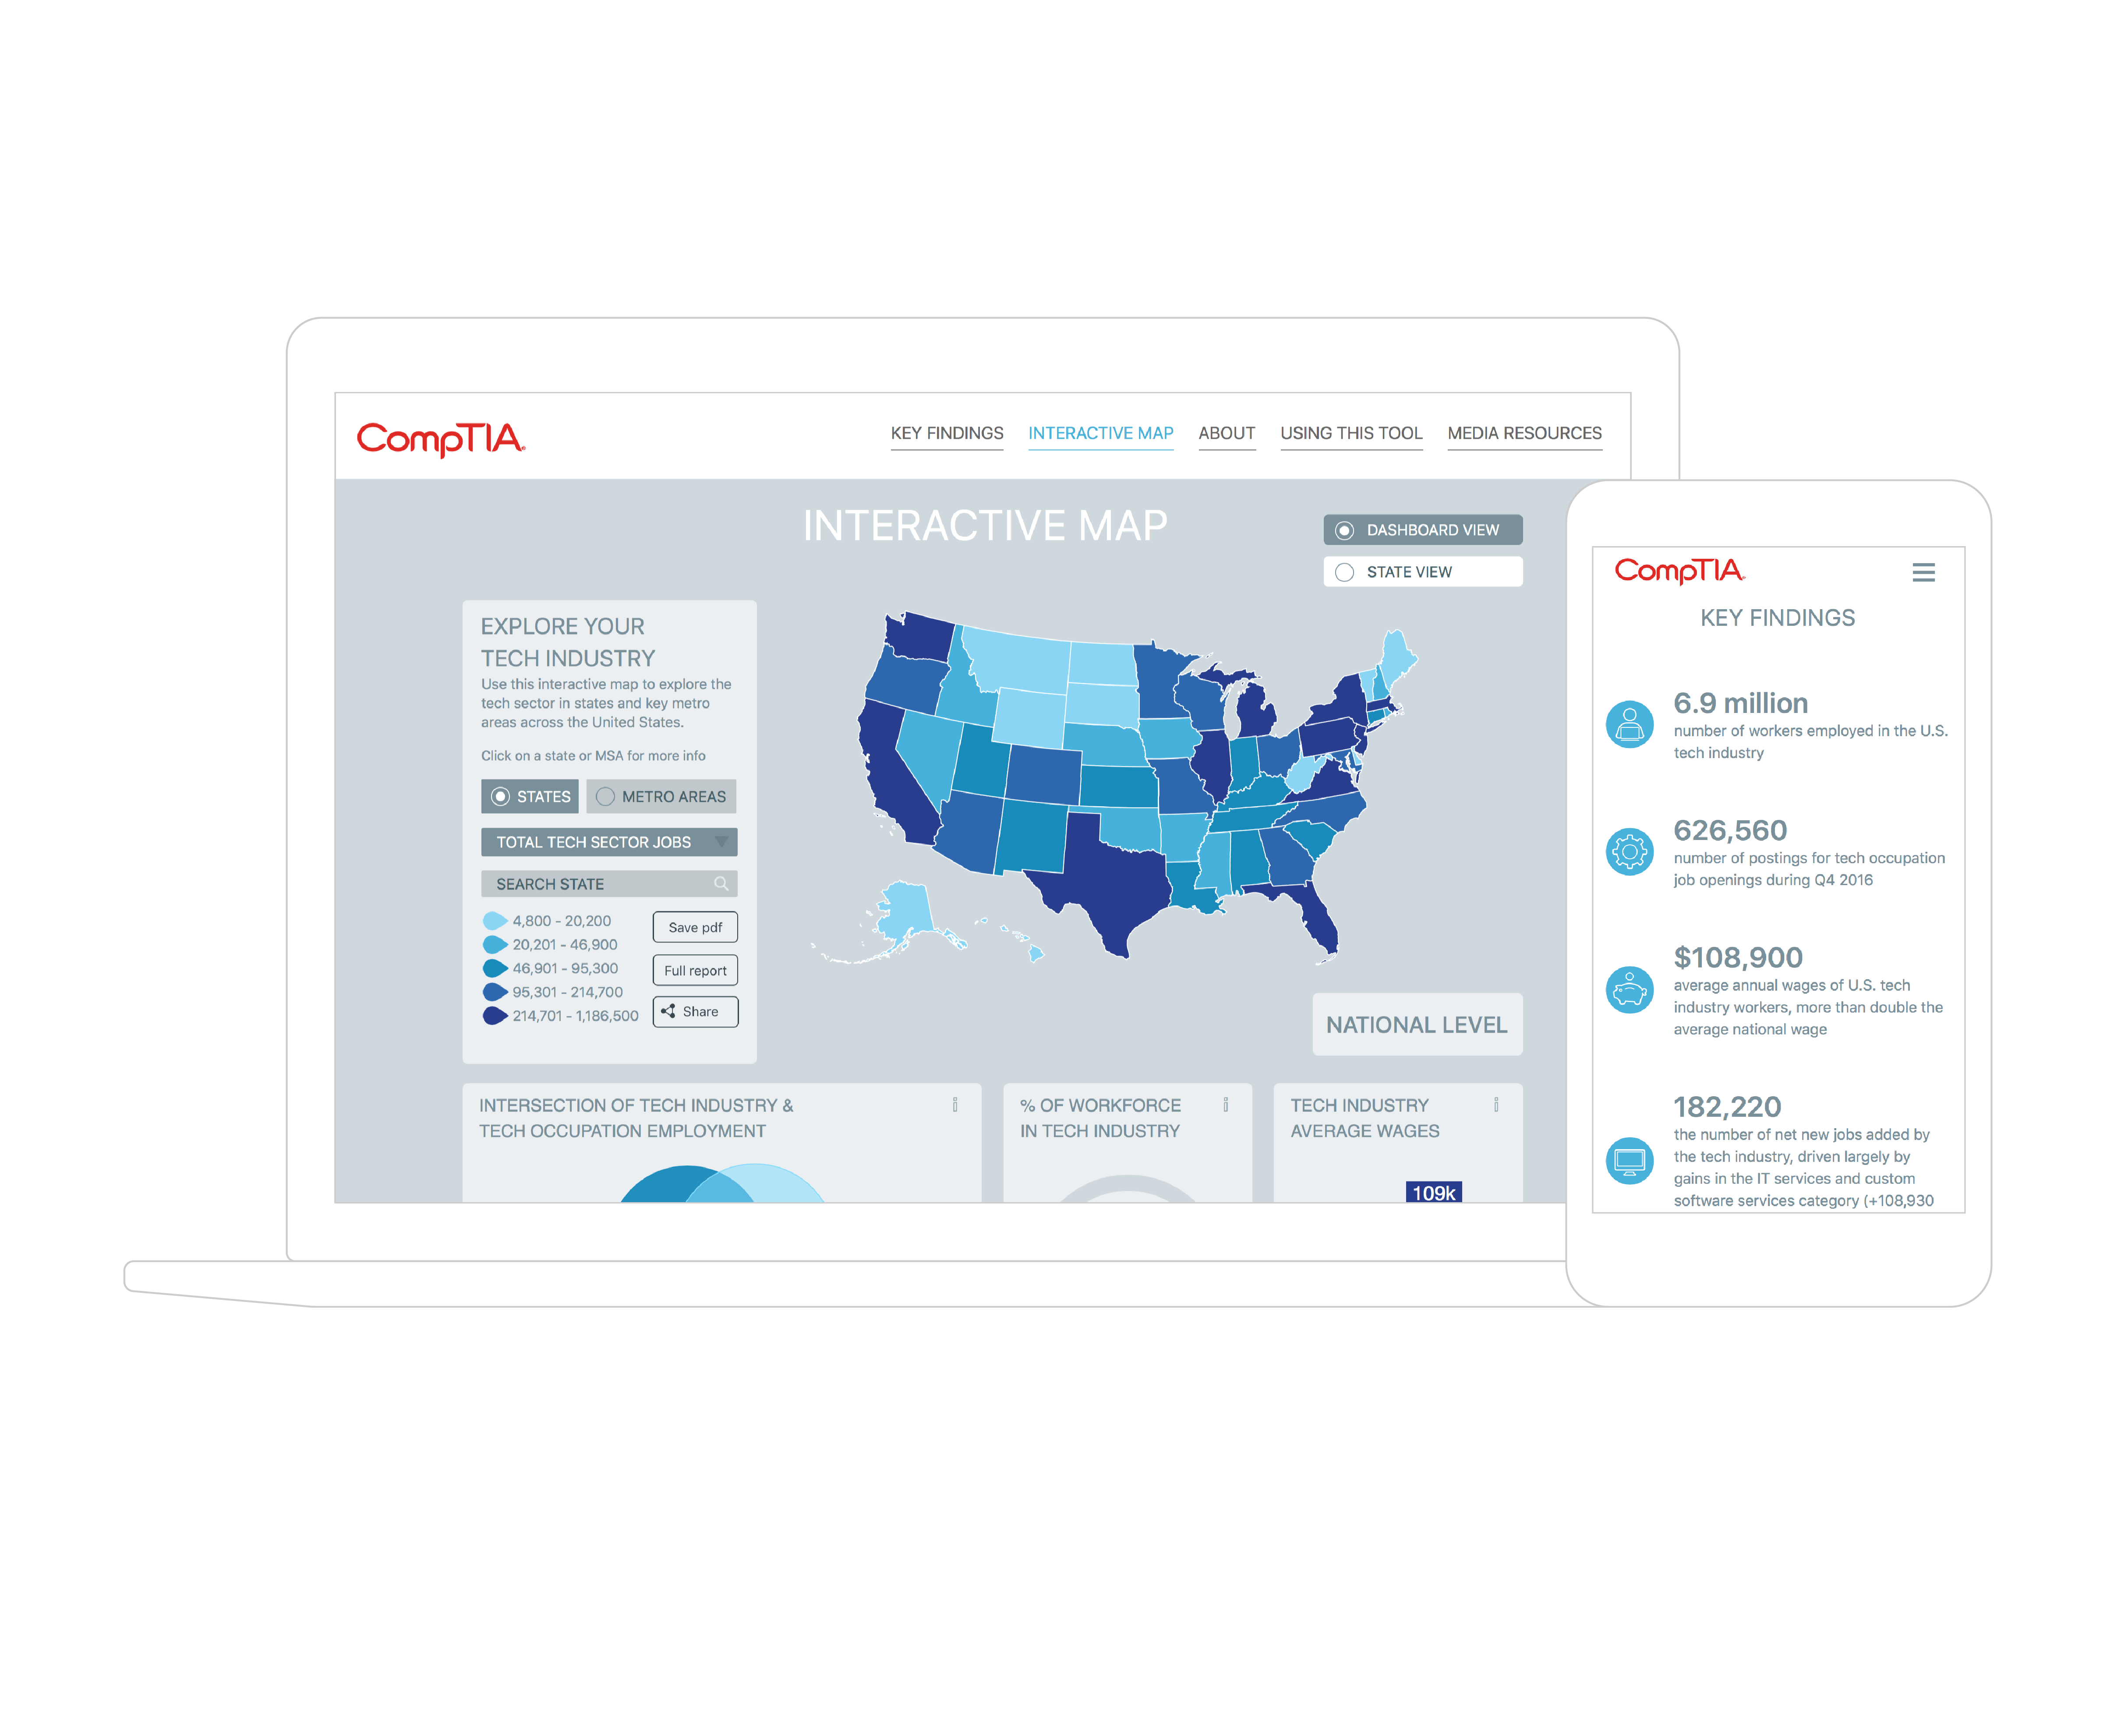
An intuitive and interactive solution, taking rich data and presenting it to users in a useful and intuitive format.
We designed and developed cyberstates.org, implementing an interactive tool with two main components: an interactive map and dashboard. The interactive map allows the user to hover over different states and see bitesize information on the total amount of tech jobs and the employment rank. The dashboard visualises key details in a compelling way using information design to create a hierarchy. With our user-centric approach, we identified what users would want to see on the platform, prioritising data that was more important and relevant.