Enabling non-profit leaders through compelling data experiences
Reading time
Category
Data dashboards are an incredible resource for gleaning actionable insights at a high level. But what happens when data literacy is low and user adoption proves difficult? We asked Monitoring and Evaluation Specialist Arpit Arora for his insights based on experiences working with the non-profit sector in India, where organisations are under increasing pressure to prove the social impact of their efforts.
The growing need for data literacy in the not-for-profit sector
“The team tends to look at data only when we prompt them to,” lamented Swetha Guhan, Director and Co-founder at Key Education Foundation (KEF), an early childhood education not-for-profit based in Bangalore, India. This is a grievance I’ve observed from many organisational leaders during the last six years while working in the social impact space.
Over the last decade, the monitoring and evaluation of social impact programmes have become increasingly prevalent across India. Impact-driven organisations have become more aware of their needs to track various aspects of a programme, and how they can use data in better designing their interventions for sustainable impact. And as the aspirations to measure impact have increased, so has the need to build capacity to sufficiently analyse and understand the data collected as a basis for taking appropriate actions.
Organisations like KEF are often helmed by passionate individuals who believe in the mission of their work and the impact it’s creating, but they often struggle to engage with the data behind it. “Their first introduction to data is often through complicated Excel files that intimidate and dissuade them from exploring it further,” says Menaka Menon, ex-Lead of Vyapaar at Udhyam Learning Foundation (ULF) with a focus on livelihoods programmes.
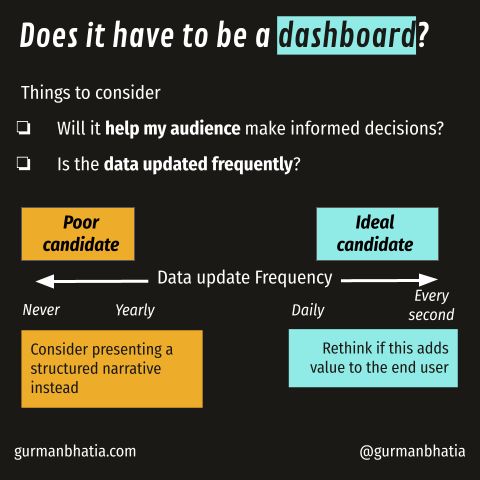
Realising this need to better track their programme and limited capacity of the existing teams, many organisations choose to bring in individuals who hold expertise in working with data and can help them maximise the potential of working with it. And the first aspiration that many programme teams hold is to have access to their own “data dashboard” that presents all of their programme impact data in an interactive, easy-to-explore format.
Earlier in my career, I used to be very excited by the proposition of creating these dashboards for the programme team, thus providing them with all the key information they needed. But I would also notice, more often than not, that these dashboards would not be adopted. The programme team would regularly come to me with questions around the data, and I would frustratedly point to the specific dashboard view that contained the exact same information, and wonder why they were refusing to use it. “I used to try exploring the dashboard and understanding the data, but I would always doubt if I was interpreting things correctly,” recalls Anamika Radhakrishnan, ex-Product Manager at StoryWeaver, an open digital storybook platform.
Taking this feedback back with me and exploring the issue further, I realised that the issue was not in the adoption of the dashboard but in the team members not being familiarised with the data they were collecting and how to engage with it.
Dashboards in themselves are great tools to enable data exploration and decision-making when used in the right context. What’s important is to understand the current backdrop in which your users are engaging with data and building data-based tools for their needs. In my use case, with the limited data literacy of programme owners, the dashboard would merely end up becoming another layer of complexity between them and the information they needed to improve their interventions.
Contextualising the information to your end users
Many of the not-for-profit organisations I’ve engaged with operate in resource-stricken environments in which the programme owners are also the primary custodians of the data for their interventions. With their existing responsibilities of leading the programme, managing the team and any external communications, exploring and analysing data can become another chore for these leaders rather than a source of curiosity or decisive action. “People don’t know what to do with this volume of data. Sometimes they just want answers to make things easy,” says Anamika from StoryWeaver.
Given the lack of familiarity around data, paired with the limited time available, programme owners seek actionable information that can not only guide the programme goals, but also help them take key decisions about improving their programmes through various interventions.
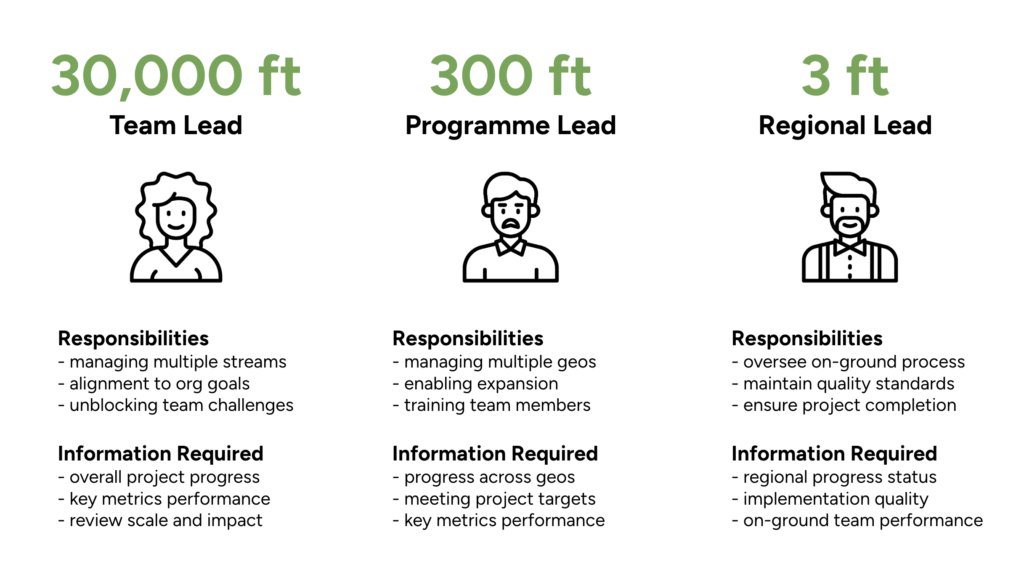
On top of that, programme teams are usually composed of members working across various layers of the intervention, where one individual might need to understand the overall health of the programme, while another implementing it on the ground might find the performance of individual team members more relevant. “At my level, it was critical to understand the impact ROI of any programme,” recalls Menon from ULF. “It guided my decision-making around which activities to continue”.
Even though, in many cases, solutions were developed that served all the individual needs in a programme, the team needed an opportunity to engage with the data and use the insights in their everyday work to develop a level of comfort around the information. “The team is on the ground, and they wonder what new things can data tell them that they don’t already know? There will be distrust in data until the capacity is built to understand and use it better,” reflects Swetha from KEF, who is actively working to build the capacity of her team on this front.
I often used to don my analyst hat, enjoying the richness of the data and believing that all information is important. Over time, I came to understand how the role of individual team members and the goals of the programme played a critical role in the information that was important to them, even before analysing what insights the data was telling me.
Without contextualising these data insights, the whole analysis was simply another data dump (though this time in a fancier UI over a spreadsheet), and not information that was useful to the specific team members involved.
It is in this light that exercises such as the “30,000 ft, 300 ft, 3 ft” framework can be most useful in gauging the appropriate level of granularity in the data needed by different stakeholder groups.
Identifying the data experience your user truly needs
To address this need for contextualisation, I find it helpful to conduct a sprint and embed myself in the non-profit programme for a brief period. This not only helps me discover how data can enable the team to achieve their goals, but also understand goals and team composition and what information will actually be useful for the various individuals.
The sprint exercise usually plays out in the following way, with key questions to answer for each step:
1. Make time to understand the programme structure
Objective: Familiarise myself with the goal and objectives of the programme, the team composition and the aspirations for their work.
Questions: What are the goals of the programme? What is the programme team composition? How are key decisions about the programme made?
2. Identify use cases for the data
Objective: Understand the role that data plays in their current and future contexts, the data-related opportunities, and any challenges.
Questions: How do the programme goals translate into the data collected by the team? How is the data currently used by the team?
3. Prototype key insights and data visualisations
Objective: Analyse the data based on learnings, then test the initial set of data visualisations, insights or outputs with the team.
Questions: How do team members interpret the information presented? How is this information useful or not useful to them? Is this information actionable for the various team members?
4. Collect feedback and iterate
Objective: Observe and enquire about the journey taken by various team members with the information presented.
Questions: What follow-up questions arise? What complementary information would help the team make better decisions?
5. Identify green shoots for adoption
Objective: Create systems to support the team in increasing their adoption of data in their daily workflows.
Questions: How often does a team member like to look at data as part of their current set of responsibilities? How often would they like to catch up to discuss new learnings based on the data?
Together, these steps and questions help provide contextual information about individual team members. They also allow me to observe how they use the information provided and build solutions for them accordingly.
In the end, the answer may still be a data dashboard, but the solution arises from their needs and not me forcing them to fit something that they would struggle to adopt.
There is no “one answer” to user-centric data visualisation
Even as I build up my understanding of the data needs and capacity of various team members in an organisation, this knowledge is rarely ever set in stone. The requirements of individuals evolve not only on a spectrum of their individual capacities but also within the context in which they are using this information. It’s important to meet your audience in the current state of attention and interest, as illustrated excellently by Alli Torban in her framework.
For non-profit programme owners, their primary intention with data may be to track progress and improve their interventions, but their responsibility ranges beyond this. They also need to discuss the findings with other team members to support or motivate them, to communicate progress with the organisation’s leadership, and even to report the impact created to existing and prospective funders.
All these scenarios require different flavours of information and communication, but the end goal is always to build the data capacity of the programme team at the organisation. As a result, increased data literacy, capacity and maturity conveys the right impact to their respective audiences. As Swetha from KEF acknowledges, “I cannot take all the layered impact details of my programme to a government official. I have to limit my impact communication with them to 2, maybe 3, metrics that resonate with their goals”.
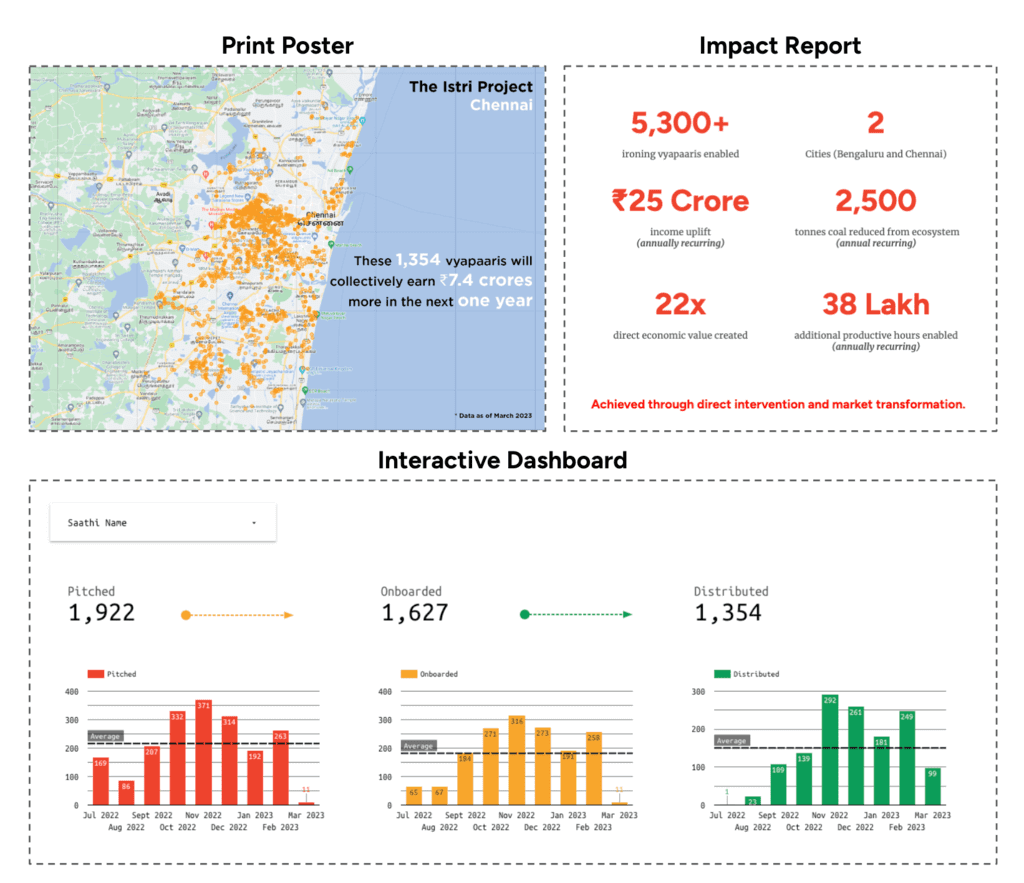
When communicating with data visualisations, it is important to remember that the information being shared is also telling a story about the programme, and the narrative needs to be adapted to that context. All the analysis and complexity needs to be hidden away and only presented if the user requests that information. The data visualisation then becomes only a medium to present the information and not the main output. And in the right scenario, data tables can be great data visualisations, too!
But I think that the story doesn’t end here. As my understanding of the data-related needs of leaders at non-for-profit organisations has evolved, so has the belief that there is another layer beyond contextualising information for the end user. Data visualisation practitioners like me are trained on the general principles of using different types of charts for different needs: like a bar chart for categorical data, a line chart for trends, or even a pie chart for composition of a whole. And then we further break down any chart to its key components (like title, axis, legend, etc.) to communicate relevant information.
But what if my audience doesn’t see a bar chart in the same way that we do? Or the line chart doesn’t make them think of trends? What parts of the data visualisation does my end user notice?
In my next piece, I want to explore the many lives a data visualisation takes depending on who you show it to, and how you build a shared language to communicate important information.
Thank you Arpit for these insights into a sector that is so important to social impact worldwide. We regularly work with non-profits looking to do more with the data at their disposal. If you’re one of them, reach out to us to find out more.
About Arpit Arora

Arpit (who likes to go by ‘cube’), a statistician by trade, has been working on the intersection of data and technology to increase access to information, improve data literacy, and drive action towards impact in the social development space. Some of their work includes: measuring the impact of product-led interventions on the livelihoods of street side ironing nano-preneurs in India, designing a data platform for the Scottish Education Department, publishing a report on the state of Free and Open Source Software in India. You can read about all of it and more at https://thedataareclean.com/