Are climate change visualisations just preaching to the converted?
Reading time
Category
The data visualisation people at NASA have done it again. Their latest visual, Sea Level Through a Porthole, is breathtakingly simple and conveys the message that sea levels are rising through the use of a wonderful visual metaphor.
It’s also gone viral on LinkedIn, and my timeline is absolutely eating it up.
But of course my timeline would eat it up. Because my timeline is full of sustainability experts, passionate climate change activists and data visualisation evangelists and enthusiasts. They all get it, it resonates with them, with their passions, and with their work.
So how does this data visualisation resonate with people who aren’t on my timeline?
Well, here’s a selection of the comments:
It’s very easy to look at people who don’t ‘get’ this visualisation and just brand them as climate change deniers, right-wing fanatics, conspiracy theorists, scorched earth capitalists, selfish or just plain idiots. But that’s not a particularly helpful approach.
Whether we like it or not, climate change will impact everyone, and it will likely require everyone to each play their own individual part to make a difference. So putting people into a nice little box that we can ignore or point and laugh at isn’t going to make things better.
The three comments I’ve picked out are all variations of a theme, and that theme is not climate denial. The theme is “But what about me? What about what I see?”
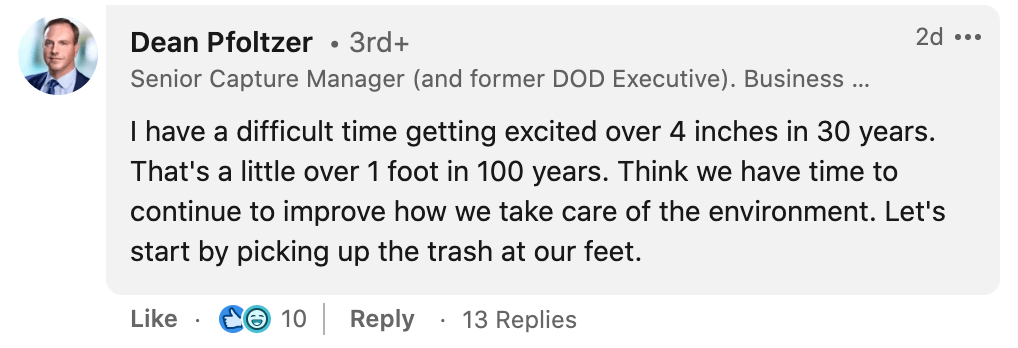
Commenter #1 is likely thinking: “A few inches over a few decades isn’t such a big deal – I see trash all over the place where I live, let’s do something about that instead.”
What they’re saying (without saying) is that sea level rise is a huge macro topic, one that’s so huge it’s difficult for them to focus on, or to even imagine how to make a dent in. Instead, they can have an impact on something smaller-scale, like the amount of waste strewn across the street.
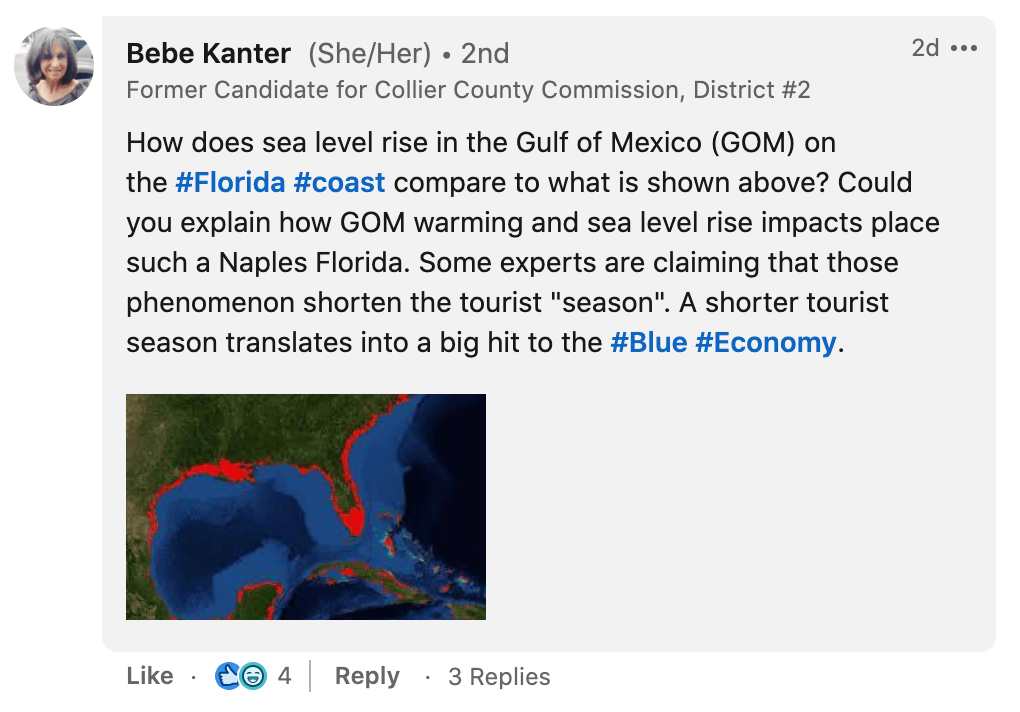
Commenter #2 is likely thinking: “That’s interesting, but I wonder how this plays out on a local level, specifically my local level, where I live.”
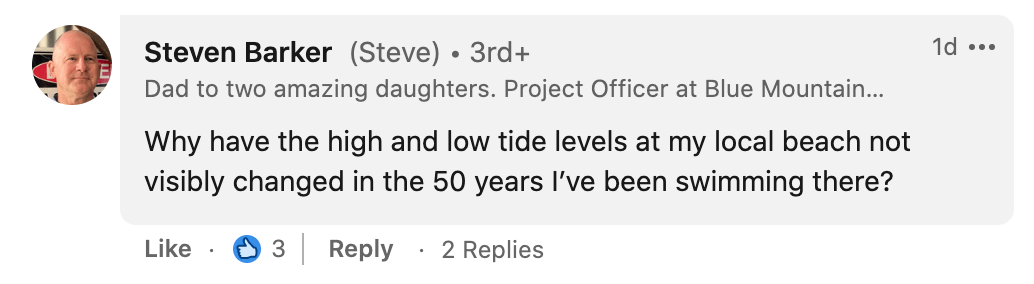
Commenter #3 is probably the easiest to point the finger of ridicule at, as they’ve been swimming in the same place for 50 years and haven’t seen any change.
The visualisation doesn’t even begin to address any of these issues at all.
So that immediately prompts the question: “Is this really a good visualisation at all?”
And the answer to that, as is so often the case, is “it depends.”
Yes, I know that sounds like a cop-out answer, but bear with me. Because it all depends on the original goals of the visualisation. Why did Andrew at NASA decide to make this visualisation in the first place? Who was he trying to reach? Why? What does he want them to do with this information?
If the goal was to articulate sea level rise in a unique, creative, yet incredibly clear way, then this visualisation is a bona fide success. It’s perfect. I absolutely, categorically could not have done it any better.
But if the goal was to win over climate change deniers, right-wing fanatics, conspiracy theorists or scorched earth capitalists, then it’s probably failed. The reason it fails is because the visualisation simply presents cold, hard, statistical, scientific fact.
There was a time when I thought that this was enough. This is what data visualisation is all about: showing people the facts, in creative ways, that makes it easy to understand. But let’s be honest, if you’re a climate denying type, you still understand what this visualisation is saying. You can very clearly see that sea levels are consistently rising. That is not the problem here.
So what is the problem? The problem is that cold, hard, statistical, scientific facts aren’t enough. How long has humanity known that smoking causes cancer? Does that stop people from smoking? Science fact and human behaviour/belief are often two very different things.
The keys to breaching the climate action echo chamber? Empathy and asking the ‘why’ question.
So how do we visualise the data to tackle this very human problem? For starters, I want to draw on a quote from one of my favourite authors (1Q84 is comfortably one of the most engrossing stories I’ve ever read):
“Always remember that to argue, and win, is to break down the reality of the person you are arguing against. It is painful to lose your reality, so be kind, even if you are right.”
– Haruki Murakami
This NASA visualisation has absolutely zero empathy towards those who may think that climate change is not a man-made phenomenon – that it’s ‘part and parcel’ of living on a constantly changing planet, that it’s ‘overblown’ by the scientists, that it’s not even real science at all. It doesn’t speak to them. (Again, big caveat, maybe that wasn’t Andrew at NASA’s goal in the first place).
But it does speak to a wider trend. One that transcends data visualisation and climate activism and reaches out into the murky waters of political discourse. People on the opposite ends of an argument often don’t express that they care what the other side thinks or feels, and that they aren’t really interested in the ‘why’ that lies behind thoughts and feelings.
Without knowing the ‘why’, we have no hope of understanding each other, no hope of communicating with each other properly. And that will only further entrench the deeply held views of both sides. The ‘why’ is my reality, so if someone is trying to tell me that I’m wrong, that someone is essentially trying to shatter my reality. Cold, hard facts are not necessarily going to work on their own.
3 compelling examples of empathy in data visualisation
Happily, empathy is out there if you look at social justice more broadly. Here are some recent examples:
1. NYT Mobility by the New York Times
This animated visualisation follows the lives of black and white girls raised in poor families, tracking the disparities in social mobility that ensue. Each individual within the study is represented by a single dot, enabling a clear picture to be built up.
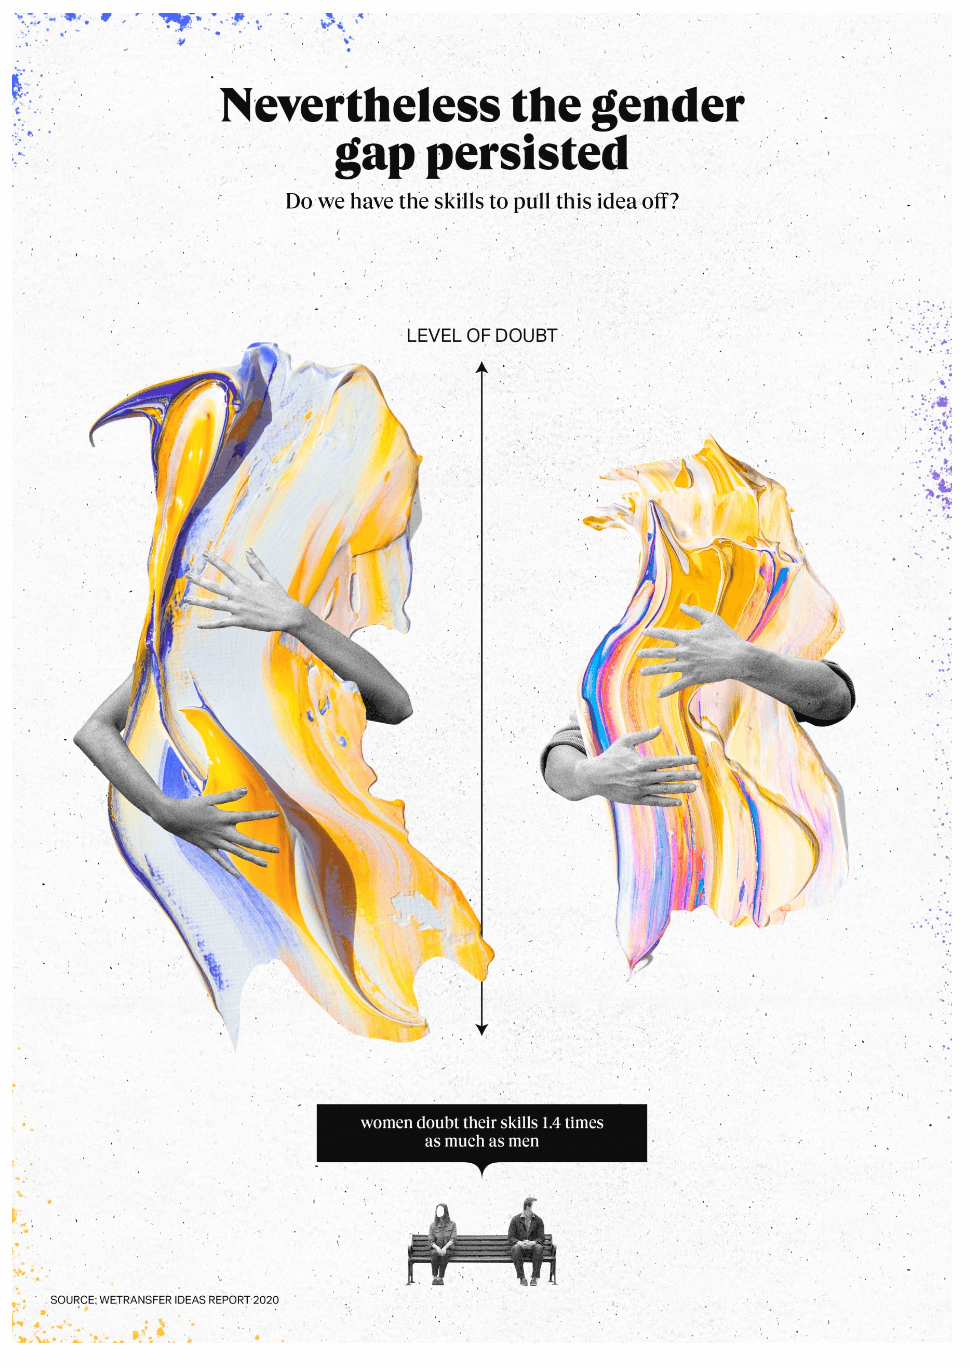
2. The Ideas Report (visuals by Gabrielle Merite)
Instead of representing gender gap data as cold, soulless bar charts, Gabrielle has chosen to represent the level of doubt in their own skills across genders, with women carrying a greater burden than men. The data is humanised by the presence of actual humans, in the form of a hug gesture.
3. Near You, an infogr8 project for Friends of the Earth
The Near You tool from Friends of the Earth is entirely focused on your local area (in the UK), showing the user a whole host of information relating specifically to them. The tool also enables users to compare the performance of their local council against government targets and similar councils.
4. Drowning in Plastic by Reuters
This piece of data journalism outlines our collective addiction to plastic bottles in various visuals. The scale of the problem is visualised first through a motion graphic showing the number of plastic bottles sold since you opened the link, and this is followed by a series of visual comparisons with iconic world cities and landmarks.
In the end, then, if we want to visualise for social impact, we need to think of our audience, and what kind of impact we want to land on that audience. If we’re looking to ‘show them the light’, we need to show empathy for their current reality, to “be kind” in Murakami’s words.
Empathy reframes the easy out of ridicule as: “You’re not an idiot for thinking that climate change isn’t a thing – I can see why you may think that, but look at the world around us, around you. The signs are there when you know where to look, so let’s do something together to solve it?”