In sustainability and climate action, organisations have a wealth of information available, and a wide variety of stories that need to be told.
With increased regulatory focus emerging in the EU and set to drive ESG globally, now is the time to get this data in order.
Our Climate Action Dashboard confronts these sustainability data challenges head-on, empowering organisations to have everything, from everywhere, all at once, regardless of industry or sector.
Join us for a deep-dive into our latest scalable solution for organisations ready to walk their talk around sustainability.
Addressing the sustainability reporting challenge
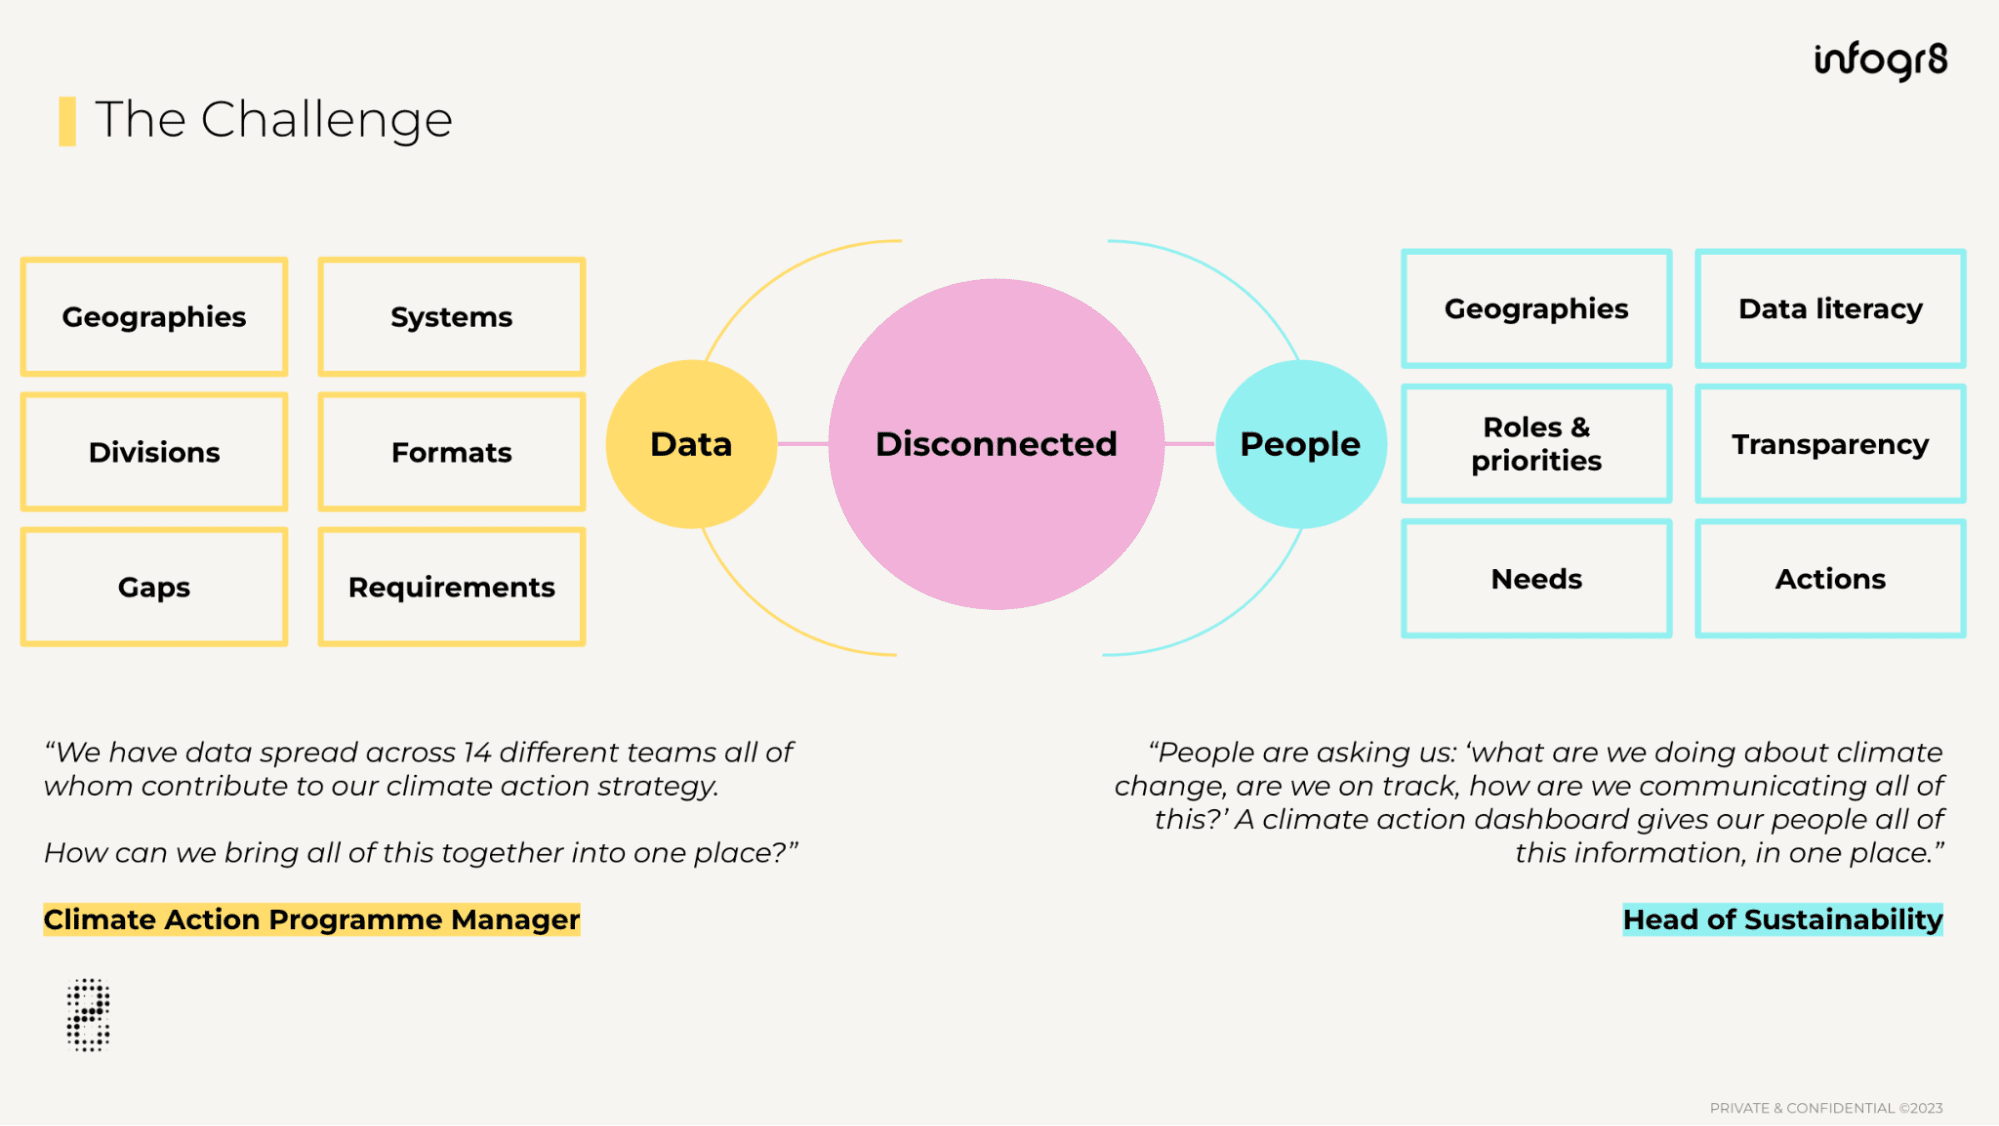
The crux of the sustainability reporting challenge is that two key factors are disconnected: Data and People.
Typically, sustainability data is spread across different geographies, in different systems, divisions and formats – often with varying requirements and data gaps.
And then we have the users of your data. Multiple audiences with varied levels of data literacy, and all with different roles, responsibilities and needs.
Here are some of the things we hear from sustainability leads facing up to this challenge:
“We have data spread across 14 different teams all of whom contribute to our climate action strategy. How can we bring all of this together into one place?”
— Climate Action Programme Manager
“People are asking us: ‘What are we doing about climate change? Are we on track? How are we communicating all of this?’ A climate action dashboard gives our people all of this information, in one place.”
— Head of Sustainability
So how can you put sustainability at the heart of everything you do, especially if you don’t have a central hub for all your key sustainability data? And when you are able to unlock your data in one place, how do you make sure you’re telling the critical stories for everyone, at all levels, while inspiring real action?
At the moment, the most commonly used tools are static reports and Excel spreadsheets. Innately clunky, dense and difficult to engage with.
Increasingly, sustainability teams are dipping their toes into the world of business intelligence tools like Tableau or PowerBI, which are great for building rapid proof-of-concepts, but relatively few are creating bespoke, holistic and user-centred solutions.
But here at infogr8, our solution is a little different. We’ve come up with an interactive, data-led Climate Action Dashboard tool that can be deployed by public-sector organisations and private companies alike.
This tool acts as a hub for your climate efforts, demonstrating your commitment towards the fight against climate change whilst opening up your targets, goals, plans and progress to your key stakeholders.
The Climate Action Dashboard is interactive and customisable for different user audiences – including local residents, business owners, or committee members – and showcasing the areas of local government that matter most to them.
Our prototype dashboard was created with local authorities in mind, but the solution is scalable to any business, in any sector or industry, where sustainability reporting is a priority.
Want to see a version of the Climate Action Dashboard in your organisation?
Engage directly with your audiences, all in one place
Our Climate Action Dashboard enables your audiences to understand your climate action journey, to monitor performance, and to track progress towards your net zero and other sustainability targets. In one module, it delivers the critical information that your organisation needs, while enhancing your credibility with a range of external stakeholders.
Here are three key challenges that this dashboard solves for sustainability teams:
1. Reconnect your disconnected data
The Climate Action Dashboard enables you to pull together once-disconnected data from across your organisation into one centralised place. It then reproduces that data in consistent formats so the content can be shared on multiple platforms.
Armed with a practical data system, your teams can then spend less time wrangling disparate data streams and more time implementing your climate action plans.
In the example above, you can display all the salient climate action information (buildings, transport, climate resilience) to a local business owner, all in one easily accessible space.
2. Boost transparency and accountability
By presenting your data in a more accessible way, you stand to raise your reporting standards in the eyes of your key audiences. Internally, your teams will also have greater confidence in their decision-making based on the data at hand. Externally, you stand to improve your credibility with a range of stakeholders. No more static reporting or dry PDF downloads. Instead, you can offer up a future-proofed data platform built for a faster-moving world.
Our dashboard gives you space to show your stakeholders the KPIs you’re reporting on, the targets you’re setting, how you plan to reach those targets and track progress towards them, all in one place. This level of visibility builds trust with your audience, adding several layers of substance to your net-zero messaging.
3. Connect with your audiences in more meaningful ways
By combining our data and subject-matter expertise with your experiences on the ground, we can forge real connections with your audiences through accessible visual storytelling. The Climate Action Dashboard delivers an unparalleled level of engagement and personalisation to boost climate action participation and buy-in, both internally and externally.
Take the Climate Action Map feature. By highlighting local initiatives and recording user feedback, you can shine a spotlight on what’s working best and where. Is that new cycle lane a boon for commuters? Are those solar-powered street lights making residents feel safer walking home at night?
Static reports can’t talk back to you or inform your decision-making. Through user-generated, on-the-ground feedback, our Climate Action Dashboard can.
Find out more about how a Climate Action Dashboard would fit with your organisational needs, whatever your level of climate action data maturity.
Let’s co-create your own Climate Action Dashboard
This isn’t our first rodeo. We’ve worked with top-tier organisations to uncover the full potential of their climate action data by building interactive and engaging experiences that are accessible to all.
Our proven Data for Everyone® framework connects experts from the worlds of data, product and sustainability, meaning we’re able to co-create user-centred solutions for advancing and tracking progress in the areas that matter most.
We offer free Lunch and Learn sessions (in-person or virtual) to discuss your climate action reporting plans in more detail. Book an intro call with me to find out more.