Transformation
Edelman Trust Institute
Challenge
-
Edelman possessed a vast and rich dataset spanning 25 years of global trust research. However, the sheer volume and complexity of this data presented a core problem: they had all of this data, but couldn’t tell the right story.
The data could be analysed and presented in countless ways, making it difficult to land on a clear, compelling narrative. There was no single format that allowed audiences to explore the breadth of findings while still understanding the key trends and shifts over time.
For the 25th anniversary of the Trust Barometer, Edelman needed a tentpole exhibition piece. An interactive experience that could display the full array of data and let users explore how trust had changed across the past quarter century. The solution needed to be both comprehensive and intuitive, transforming an overwhelming dataset into an engaging, explorable narrative.

The journey
-
Our relationship with Edelman began in 2024 and evolved through a series of increasingly ambitious projects, each building on the trust and creative understanding established in the previous phase.
Phase 1: Data-led animations for the Trust Summit
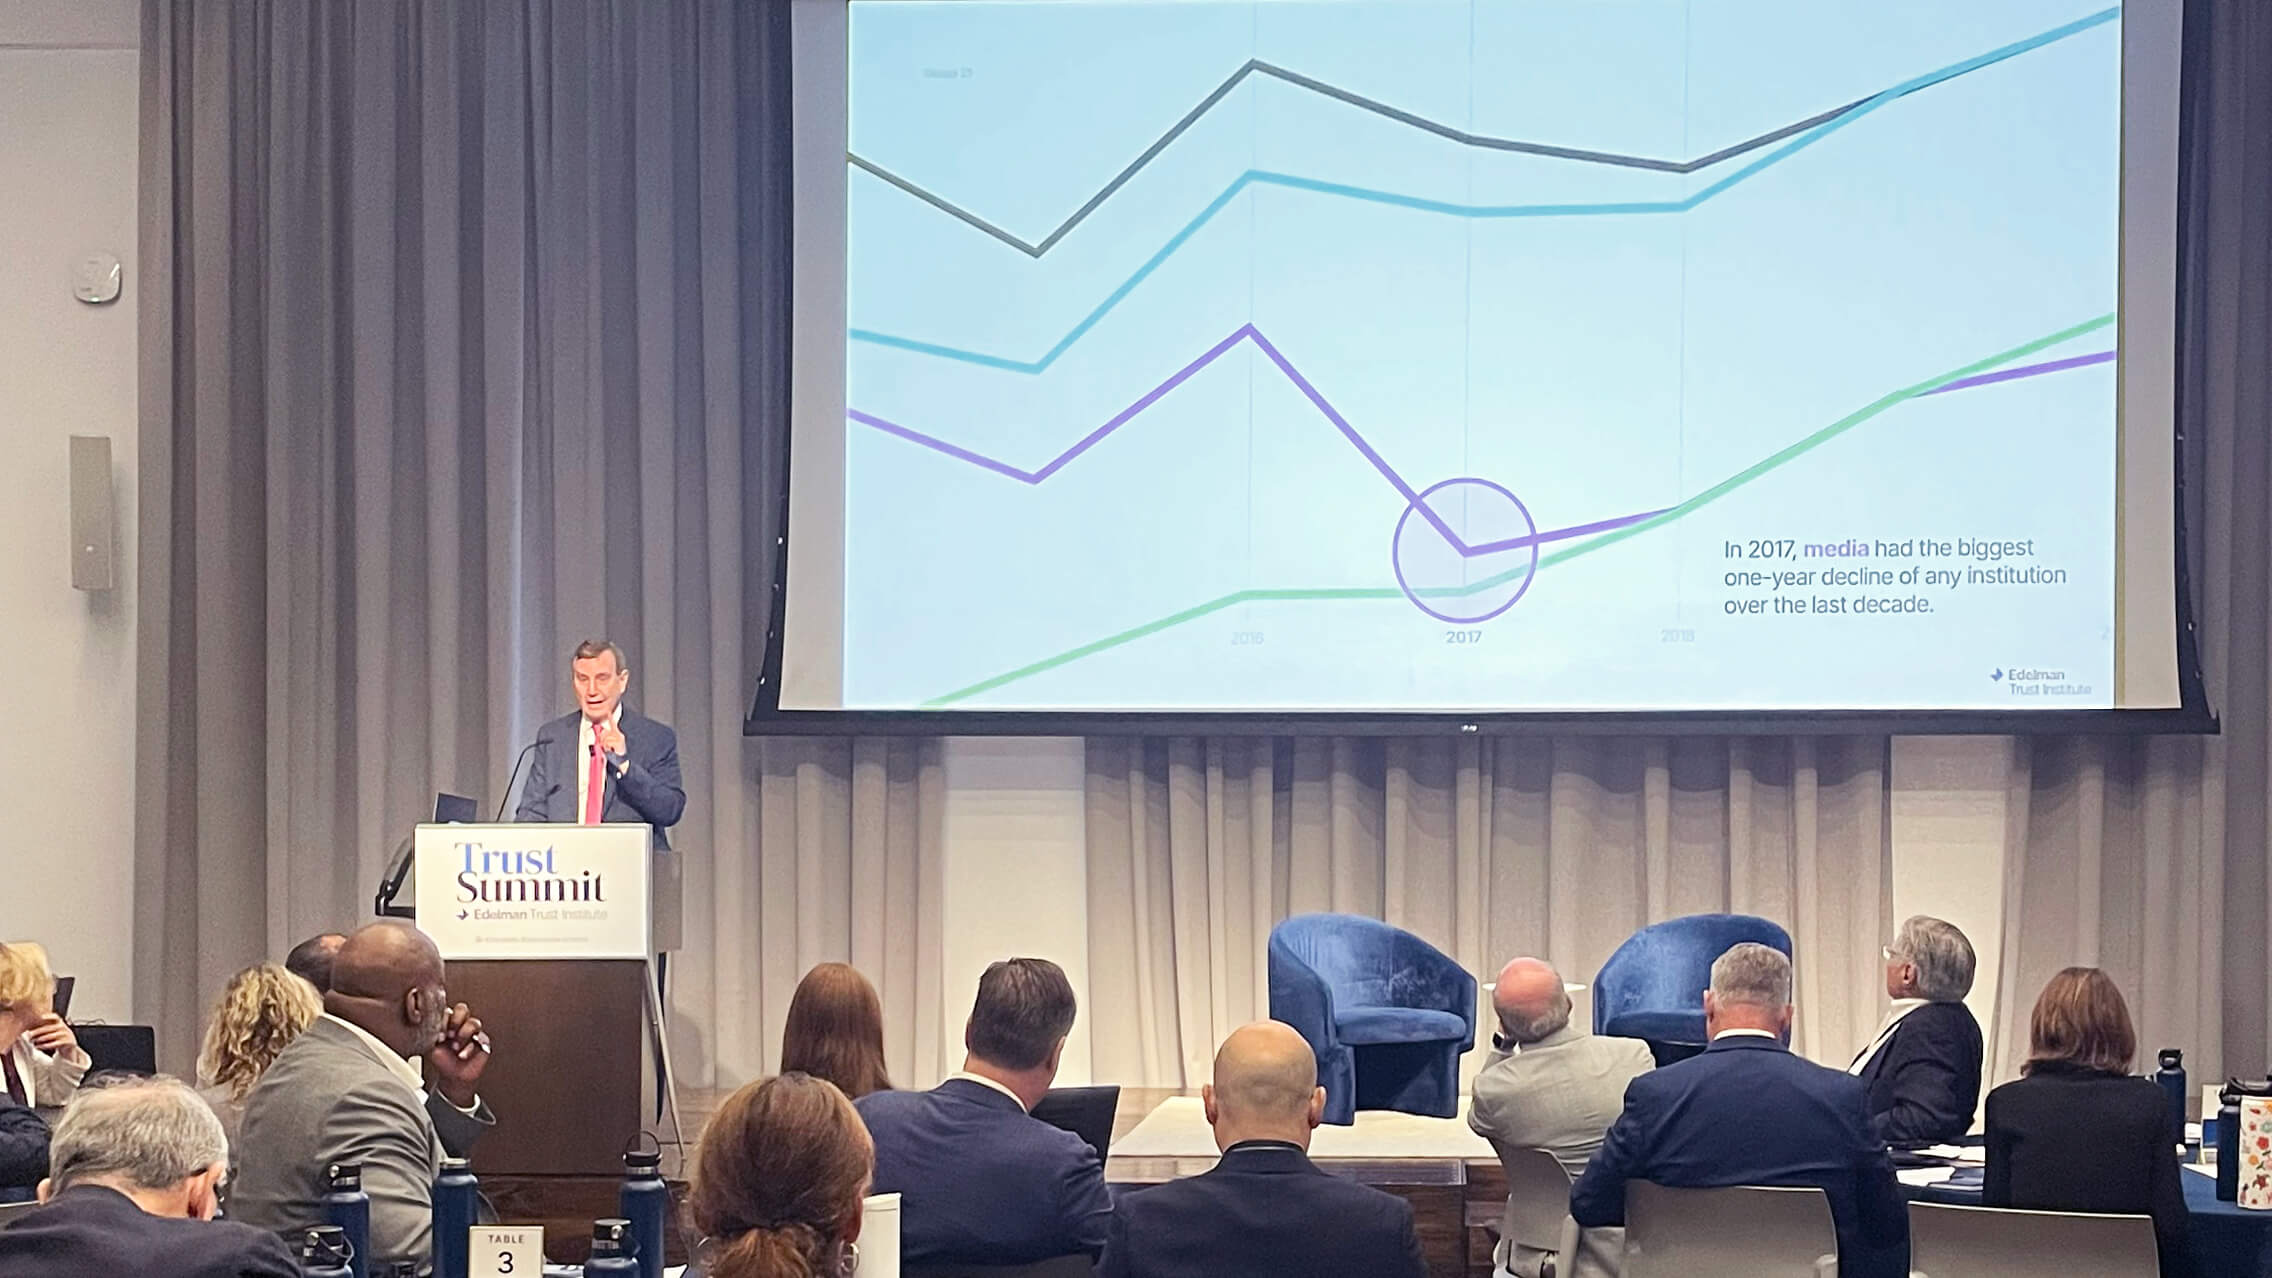
Our partnership kicked off with a high-profile brief: creating data-led animations for Edelman’s Trust Summit, a flagship event led by their CEO, announced to an audience of press, policy makers and business leaders. The challenge was to distill complex trust data into visually compelling motion graphics that could anchor a keynote presentation and communicate key findings at a glance.
This initial engagement established infogr8 as a partner who could translate Edelman’s data into powerful visual storytelling, a capability they hadn’t previously been able to unlock internally.
Phase 2: Expanding the animation library
Following the success of the Trust Summit animations, Edelman commissioned additional animated content pieces. Each project deepened our understanding of the Trust Barometer dataset and Edelman’s communication goals, allowing us to refine the visual language and push the creative boundaries of how trust data could be presented.
Phase 3: The interactive Trust Tracker
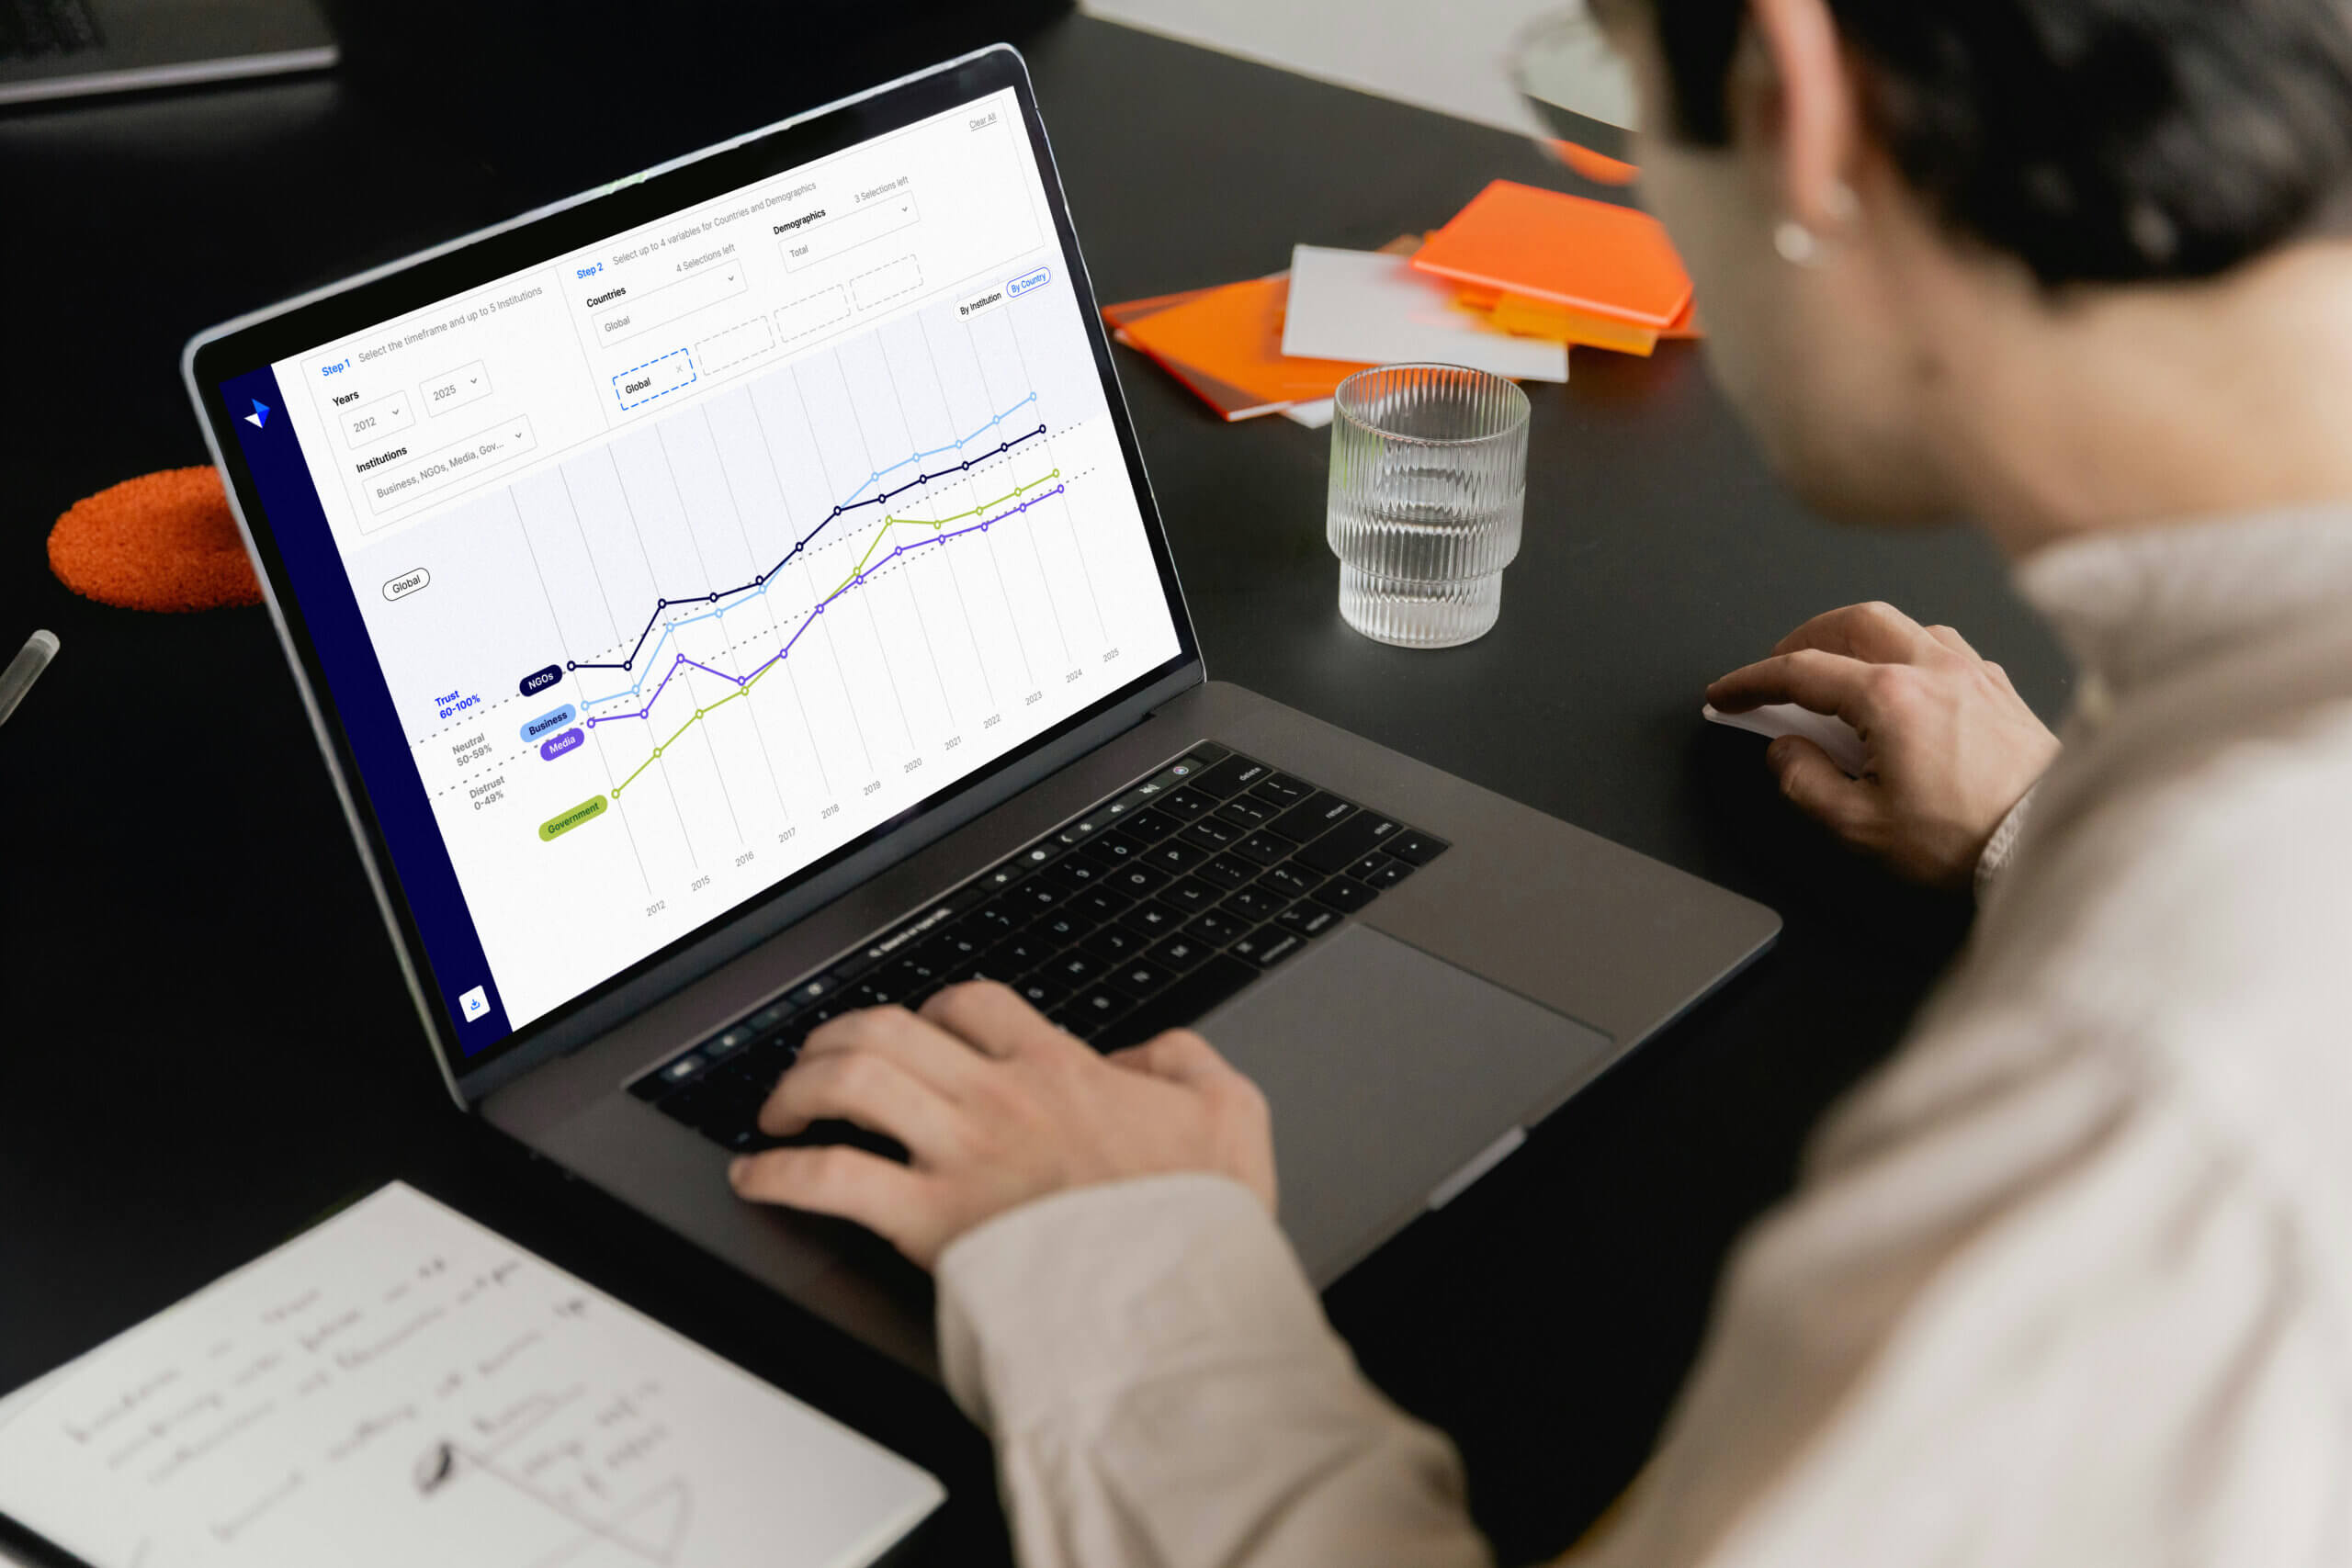
The culmination of the partnership to date: an interactive Trust Tracker built to celebrate 25 years of the Trust Barometer. This was the tentpole piece Edelman had been looking for. A digital experience that allowed users to explore the full depth of the dataset, trace how trust in institutions had evolved over time, and discover the stories hidden within the numbers.
For the first time, Edelman’s trust data was presented in a fully interactive format, giving audiences the freedom to navigate the data on their own terms rather than being guided through a single, predetermined narrative.
Phase 4: The Future of Trust
The partnership is expanding. What started with animation and interactivity now spans design systems, storytelling consultancy, and new technical capabilities. We’re working alongside Edelman to push the boundaries of how trust is measured, communicated, and understood — while strengthening their organisation’s ability to lead with data.
Results
-
- First interactive format: For the first time in 25 years, Edelman’s trust data was presented in a fully interactive, explorable digital experience — a significant milestone for the Trust Institute.
- Executive-level impact: The data-led animations received strong positive feedback for bringing the CEO’s keynote presentation to life, making complex findings immediately accessible to a high-profile audience.
- Evolving partnership: What began as a single animation brief grew into a multi-phase engagement, with each project expanding in scope and ambition — a testament to the trust built between infogr8 and Edelman.
From data to interactive intelligence: Solved the client’s core challenge of having rich data but no mechanism to tell the right story, by creating formats that let the data speak for itself.
infogr8 helped us bring insights from the Edelman Trust Barometer to life through eye-catching, engaging animations. Their team adapted to our evolving needs and worked tirelessly to ensure we were satisfied with the final product.
Data for Everyone®
- Telephone
- +44(0) 207 193 9594
- Address
Soho Works White City,
Television Centre,
101 Wood Lane,
London,
W12 7RJ
- [email protected]
Newsletter
Talent
We are always looking for great people to join our growing network of Global data experts.