 Insight
What you need to know about Brits and gay marriage

CC BY-NC-SA Antonio Guerra
It has been almost a year since the UK joined the club of countries that legalised gay marriage in at least part of their territory.
In Europe, same-sex marriages are permitted in Netherlands, Belgium, Spain, Norway, Sweden, Portugal, Iceland, Denmark and France, so the UK is not even close to be a champion of gay rights.
The first same-sex wedding in England and Wales took place a couple of months ago, and it’s expected that Scotland will follow soon. Nothing is expected from Northern Ireland.
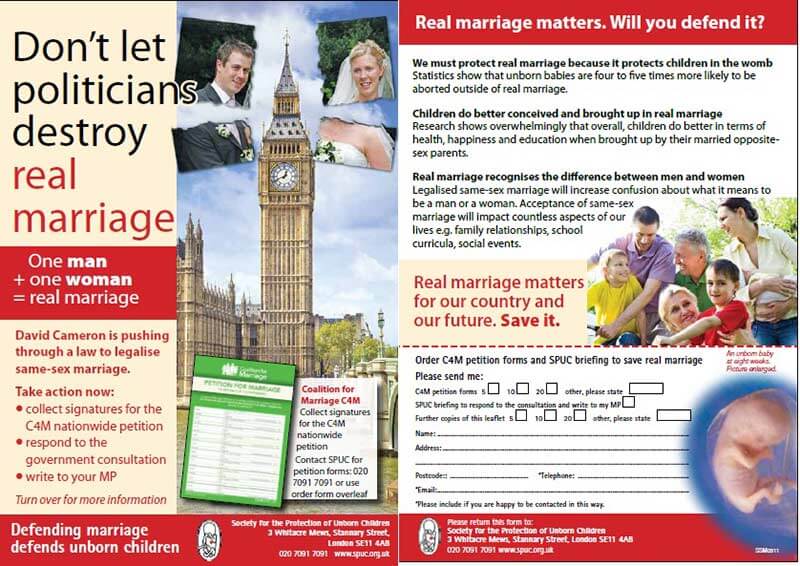
When this bill was discussed there was a lot of fuss both in Westminster and in the street. 133 Tory MPs revolted against David Cameron and it was pretty common to see people distributing leaflets like this:
But what do the Brits think about gay marriage?
Short version? They are cool with it.
Long version? An Ipsos-Mori poll showed that around a 70% of Brits agree with homosexuals being allowed to marry each other. But not every single group is that enthusiastic.
Women are by far more tolerant than men when they are asked about gay marriage. Here’s a chart to prove it.
Surprised? Not really. I kind of expected this stat. And I also expected to find the biggest difference in the data divided by age group. Older people are not very happy with the whole idea of a man marrying another man or a woman marrying another woman.
What I didn’t expect at all was finding out that Tory MPs are the ones who better represent their voters. The percentage of MPs that voted against equal marriage and the percentage of voters who oppose this bill is more similar for the Conservative Party than for Labour and Lib-Dems.
Brits look pretty tolerant with gay marriage. Was this always like that?
NO!
It’s true that now there’s a large majority of people in the UK that support gay marriage, but this is because British society experimented huge changes in the last decades. Back in 1975 the idea of equal marriage was only supported by a very tiny minority.
You know what they say…

CC BY-NC-SA Andreina Schoeberlein

