ICYMI – Weekly round up of inspiring visual content Vol. 31
Reading time
Category
Missing your data-led visual content fix? Fear not, we got you. From slick 360 video filming from Lexus to a staggering salaries in real time interactive tool from Retale, the team at infogr8 have curated the most inspiring and interesting visual content we have stumbled on this week.
CityLab
Scrollable story

Whenever London Tube drives decide to go on strike, it’s always reassuring to know that we can hop on a bike and get to where we need to go in the capital. Bike-share schemes have being rolling in all over the world in the last few years, and this scrollable story from CityLab documents the history behind this innovative means of getting from A to B. There are now over 1,000,000 bikes being shared across the globe, we just hope everyone using them have passed their cycling proficiency test.
The Globe of Economic Complexity
The Center for international development
Data driven website

From Swiss watches to Brazilian coffee, almost every county has something unique to offer the rest of the world. We previously explored the WikiGalaxy curtesy of Owen Cornec in volume 6 of our ICYMI, and now with the help of Romain Vuillemot we have now being gifted with a dazzling interactive map that visualises international trade with tiny dots that each represent $15 trillion. As well as highlighting the main trade routes, each dot is colour coded to show what is being exported, allowing us to see what goods everyone is sharing with the rest of the world. We can also dive in to explore some pretty neat treemaps that help visualise what is being produced in an even deeper level of detail.
Thomson Reuters
Data Tiles
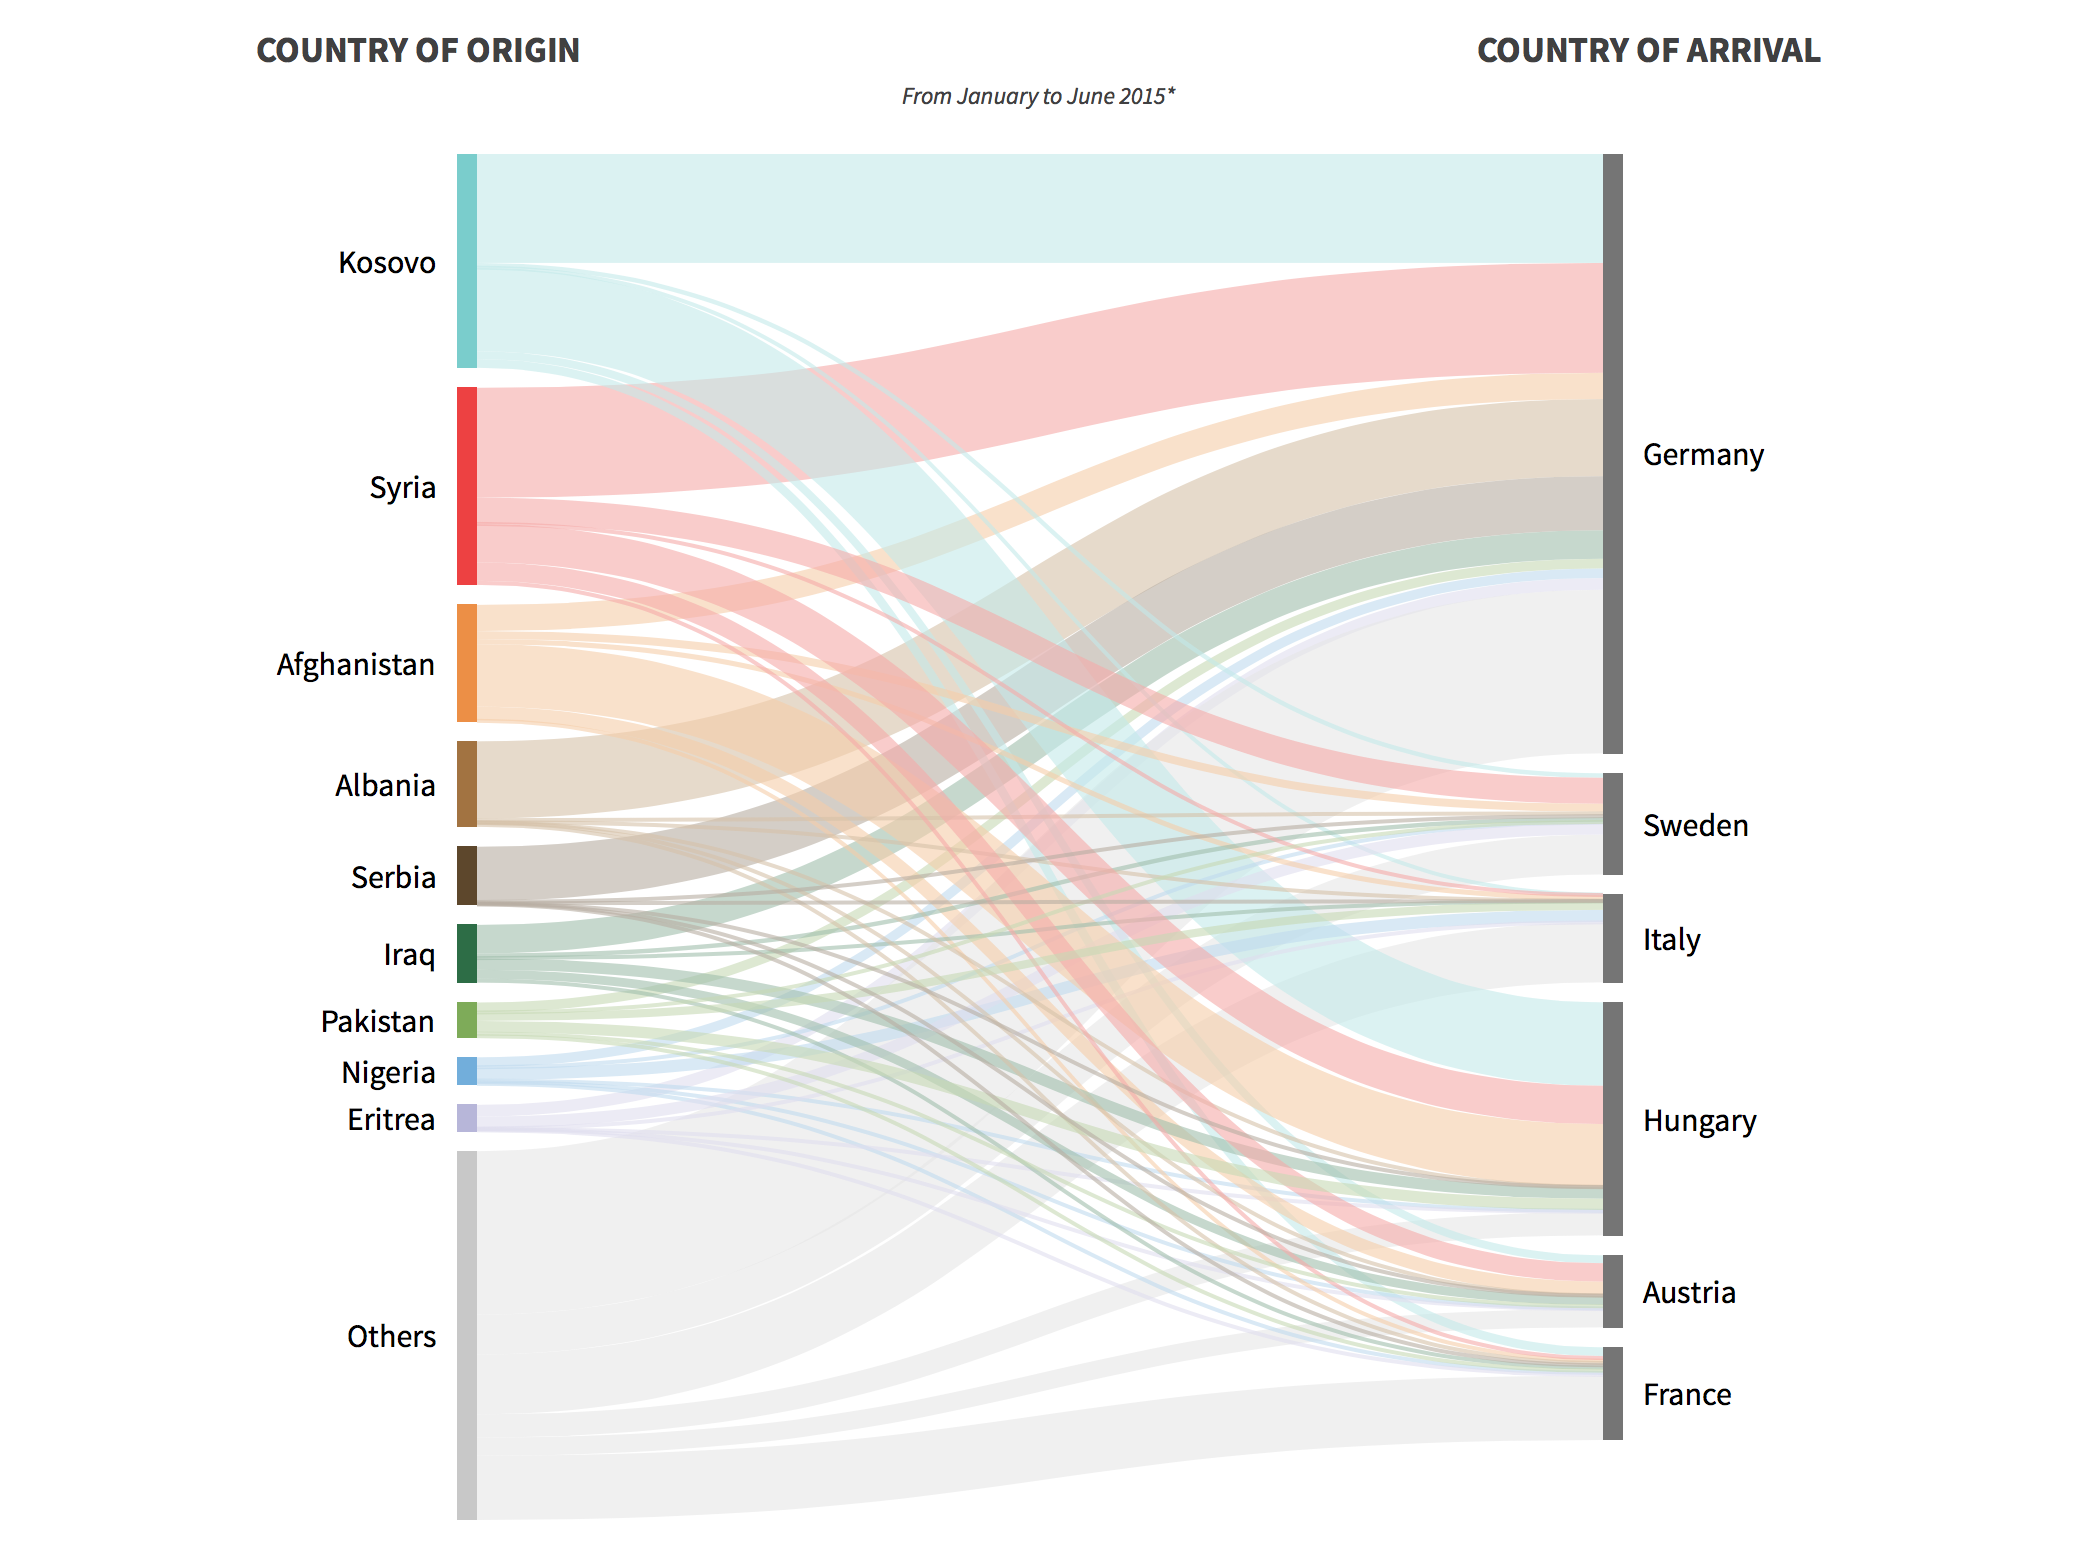
The topic of migration seems to be popping up particularly regularly at the moment. Yesterday we learned that UK net migration hit an all-time high, reaching 330,000 last year, and extra fencing was installed earlier this month on the French side of the Eurotunnel to prevent up to 2,000 people a night trying to cross the boarder to Britain. Thomson Reuters have compiled a collection of data tiles that help piece together this complex story, and explain where people are flowing from, and where they are ending up. If Nigel Farage thinks the UK has a problem, he may want to check out some of the stats from other counties first.
Retale
Interactive tool
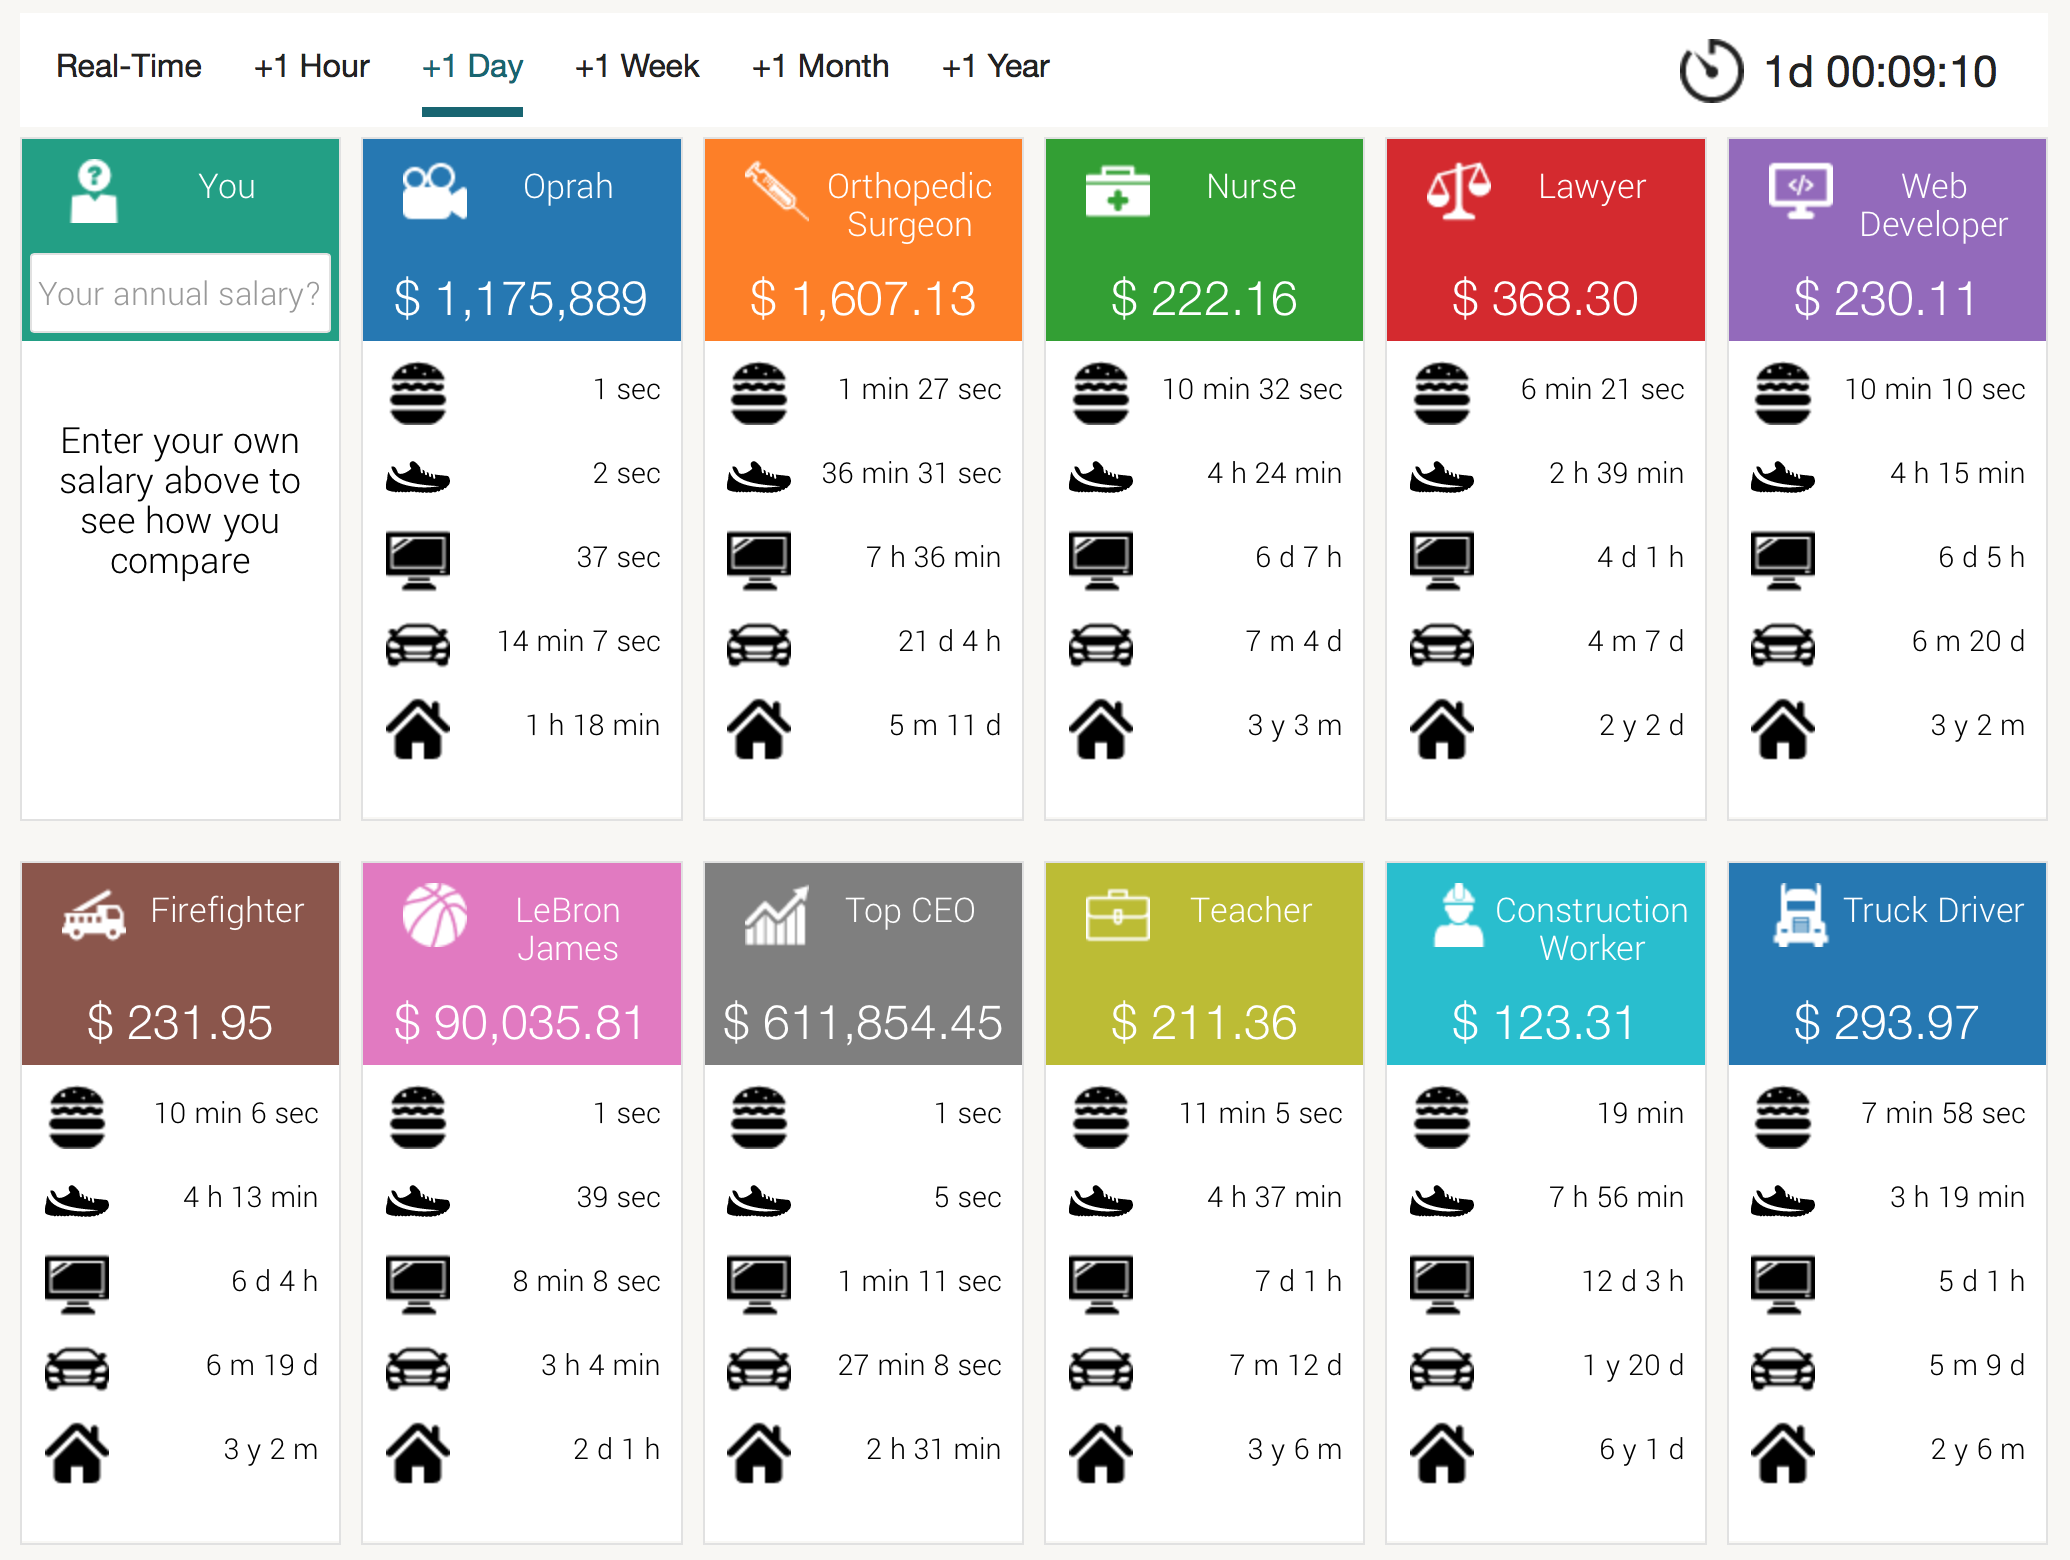
By the time you have finished reading this sentence, Oprah Winfrey will have earned enough money to buy the latest top–of–the–line wearable fitness tracker device. If you want to see how her salary crushes yours in real-time, as well as comparing how your wages fair against some other more modestly payed professions, this real-time calculator from Retale shows how much time would need to pass before we are able to fund everyday purchases, or something a little more lavish. If you are on a tight budget or a compulsive spender, this can add a whole new perspective on the true value of money to you.
This Chart Can Help Diagnose and Prevent Snoring
Dreams
Infographic

Do you snore? Or at least does you’re partner tell you you’re a snorer? Maybe you’re the the poor soul that has to suffer though your partners’ sleep depriving racket night after night? We seeming as, according to this great infogaphic brought to us by Dreams, The Sleep Matters Club, 45% of adults snore at least occasionally more that likely you have been on one or the other side of the bed when it comes to this issue. But never fear whether you suffer in silence or rumble at volume this infographic will help you understand why it happens, and through some great decision trees help you self diagnose what maybe causing you or your partners to snore and some great solutions and lifestyle tips to aid a peaceful nights sleep.
The Most Timeless Songs of All Time
Polygraph
Data Blog
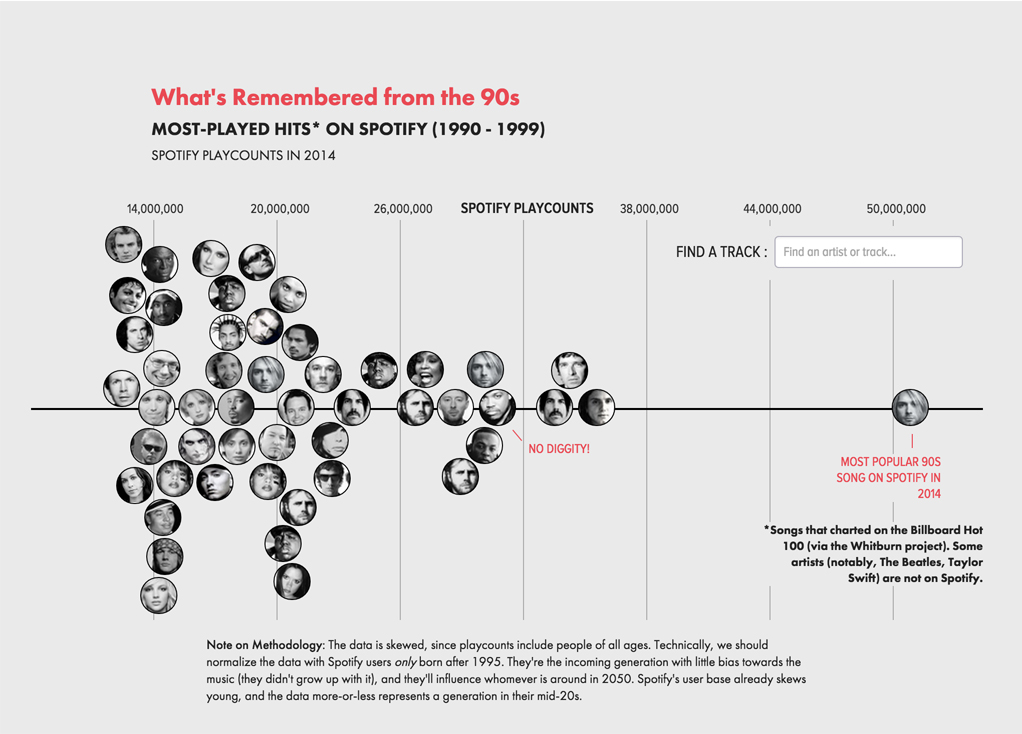
Music charts have always been the dip-stick for the gauging what songs are popular at a moment in time, but how do you measure the most popular song of the past decade or year? Of course there have been 1000’s of greatest songs of all time shows, articles, blogs and podcasts but for the most part its impossible to use past music charts as a good measure or comparison as they have been historically based on sales. Due to financial and social changes from the first uk record chart printed in New Musical Express (now better known as NME) on 14th November 1952, song sales numbers would greatly change from year to year. But with the advent of music streaming services such as Spotify offering a complete archive of music from the past we can see what songs are popular with listeners even if the singles have long since gone out of print. Using Spotify as a measure to gauge the popularity of older music Polygraph has created a incredibly interesting data blog which which uncovers some really interesting findings. Utilising a combination of interactive timelines, graphs and charts intertwined with some great writing, Polygraph show just how powerful it can be to integrate data visitation into your articles, engaging the viewer to dwell on the page unwrapping the many layers of information beyond the article itself. This blog is absolutely brimming with great information and an absolute essential for any music fan.
Lexus
Video
We’ve seen some pretty slick GoPro videos but Lexus is on to a mission to steal their thunder lately. As if 180 degrees filming is not enough, they have come up with jaw-dropping 360 biking session. This refreshing approach got us thinking – can you spice thing up adding data to supplement the video? One way to do this would be using Strava’s API and visualising real time stats while cycling like speed, distance, calories. It certainly opens up new opportunities to creating data driven video content.
NG Bailey
Interactive module

In this day and age, with every brand competing for space online, it can be hard to find an engaging way to express your message and keep your audience interested, especially if what you want to express is complex and has many different arms to it. NG Bailey knows this and created a fantastically engaging Interactive module, using a beautiful animated isometric illustration style. You can explore the city scape they have created, clicking into different buildings representing different sectors which illustrate how IP convergence is transforming the role of security for tomorrows organisations. It is a great example of how interactive modules can be used to make it easy for a user to digest complex information quickly and in a memorable way. Go visit the microsite and enjoy exploring.
We’ll be sharing more inspiration next Friday, for now you can follow the team on Twitter @infogr8. Please tweet & share your viz spotting stories to be considered for our future rounds ups. #vizspotting #ddj.
We’re hiring! Several new awesome roles within the infogr8 family including account management, digital PR manager & web development.