Soha Elghany on humanising the data at the heart of international crises
Reading time
Category
Covid. Climate. Cost of living. Ukraine. Gaza. The words ‘polycrisis’ and ‘permacrisis’ have even entered the English language to describe this sense of multiple, ongoing crises. When the numbers are so high they become unfathomable, how can data be used more effectively but still ethically? We asked psychologist and data visualisation artist Soha Elghany for her insights.
Let me tell you a story about this number:
580,000
Large numbers like this lack meaning. Our brains aren’t able to fully comprehend what a large number like this equates to.
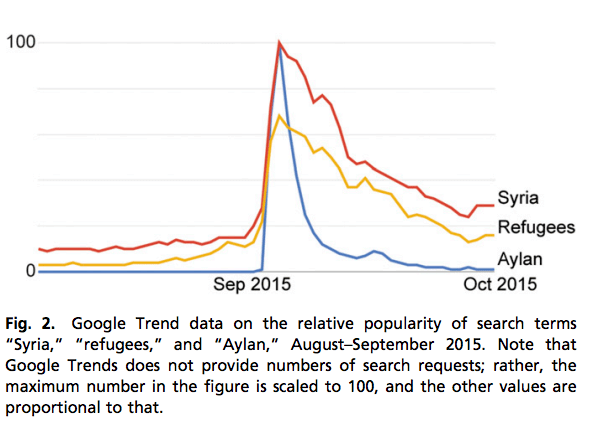
580,000 is the number of Syrian people that have been killed since the war in Syria started.
Often when we refer to people’s lives and real stories by evoking stats and figures when tragedy strikes, the response from those involved is “We’re not just numbers”. This is a phrase echoed by victims because numbers have a dehumanising effect. As ethical data visualisation designers, we must remember that each of these numbers may represent someone’s life.
The challenge: Big numbers, compassion fade, and psychic numbing
In his research on empathy towards tragedy, Paul Slovic found that the brain doesn’t respond emotionally to numbers. He calls the lack of human connection to the numbers we see “compassion fade” or “psychic numbing”. In essence, we can’t picture large numbers, so we can’t empathise with what the data is trying to convey. This is a paradox that data visualisation designers must address when dealing with social impact data.
A study by Slovic in 2017 found that as the number of victims in a tragedy increases, people’s empathy and willingness to help decreases. Slovic found that we often fail to prevent mass tragedies such as genocide or take appropriate measures to reduce losses from natural disasters because as the numbers of people killed get larger we become more de-sensitised.
Large numbers in your data visualisation won’t trigger the necessary emotion to motivate action. So we need to understand how the brain responds to numbers in social impact data to be able to design better solutions for how we should effectively communicate data to our audience.
A helpful framework to adopt ethical thinking when creating data visualisations is consequentialism. As the name suggests, it is an ethical theory that judges whether or not something is right based on its consequences. Consider the consequences of your data visualisation and the intentions behind why you’re building it. What is the message you want to get across? Why are you creating this data visualisation on this specific topic, and what is the impact you want it to have on the people who interact with your work?
A solution: Disaggregating the data to tell individual stories
In 2017, Slovic conducted a study about Aylan Kurdi, the Syrian boy found drowned on a beach in Turkey. Slovic analysed the reaction to a photograph of Kurdi that went viral; for context, the war had already been going on for four years by this point, the death rate had climbed into the hundreds of thousands, and suddenly people started caring when they saw this viral image. This image alone got people caring more than the statistics constantly thrown at them. Slovic found that this level of empathy lasted a full month.
As data visualisation designers, we need to start thinking outside the box on how we visualise large numbers while ensuring we cause no ethical harm by misinterpreting the data.
Data visualisation can be used for misinformation at the other end of the spectrum, sometimes with dangerous consequences. Below is the infamous Kallikak family tree, created by the American psychologist and eugenicist Henry Goddard:
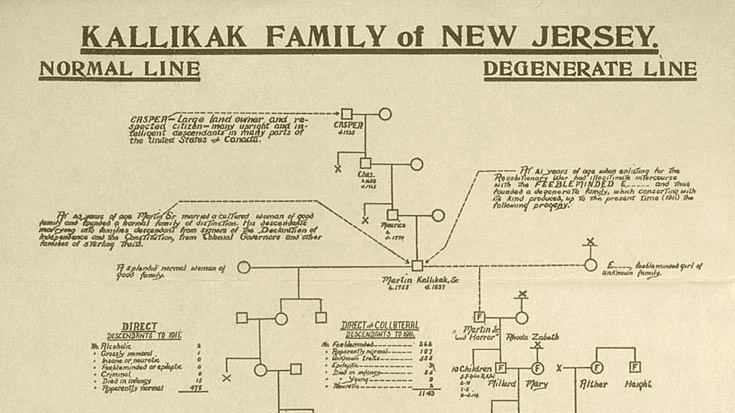
As a visual chart, it’s not ground-breaking, but its impact was profound. You see, Goddard believed that one of society’s greatest problems was people of lower intelligence. As a case study and ‘proof’, he focused on one story of his own and wrote a book based on the genealogy of one of his patients. According to Goddard, “feeble-mindedness” was hereditary, and the Kallikak family was full of what he called “the lowest types of human beings”. But it was all a fiction.
Despite this fabrication, the chart based on the Kallikak family tree could still be found in school textbooks as late as the 1950s – it was also used by the eugenics movement for decades afterwards. And it was adopted by the Nazis, who used it in propaganda films to gain support for their racial purity laws, which led to the murder of thousands of disabled people in the Holocaust.
Beyond the numbers: The power of human visualisation
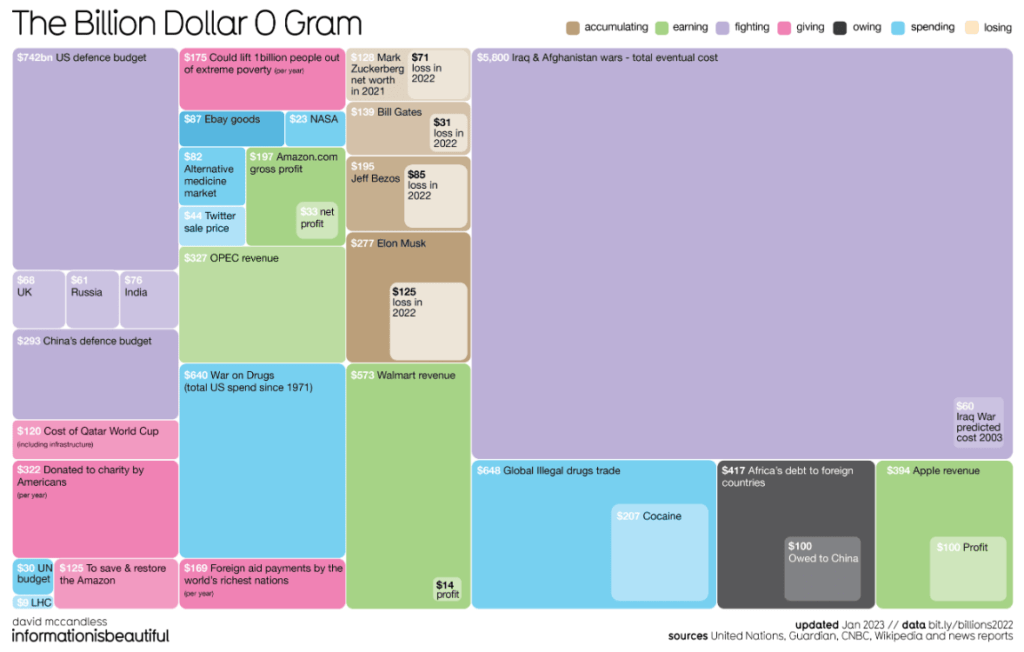
Another time we regularly hear large figures is when it comes to government spending. Information is Beautiful’s David McCandless wanted to visualise these huge sums in an unconventional way to help people gain a better understanding of money and how government budgets sit concerning other figures, from the net worth of private individuals to the cost of military campaigns overseas.
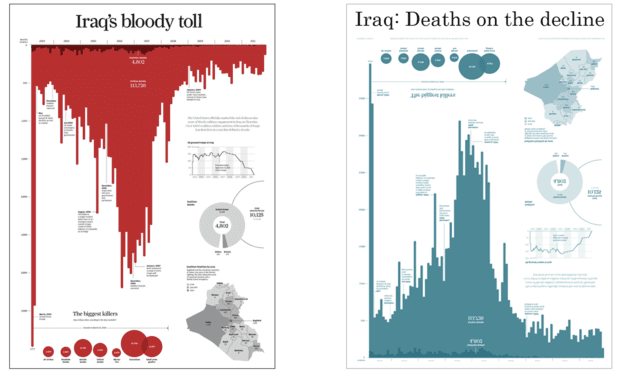
Visual imagery is how you get people to care. One example that stuck out to me when I first saw it was this Iraqi visualisation by Simon Scarr. Iraq’s Bloody Toll is the original visualisation he created, where he emphasises the lives lost in the war. Just by flipping the chart and changing the colour, you see a completely different story with the same data.
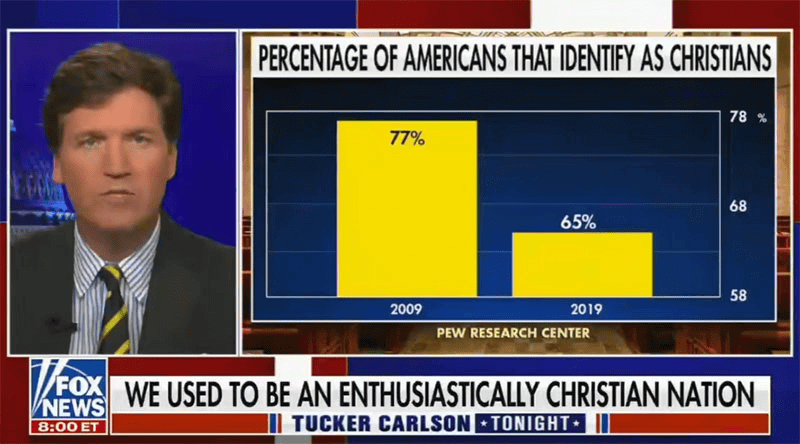
This is where ethics comes into play when it comes to deciding what is the appropriate chart to use. We’ve all seen those charts that play around with the axes to give the impression of larger differences. In 2009, we see this Fox News graph about Christianity in the US declining. In reality, the decrease is relatively minor over 10 years. But the y-axis on the chart only begins at 58% and stops at 78%, so the 12% decrease from 2009 to 2019 appears far more drastic.
Staying in the US, Presidential elections can be divisive and controversial. The most common way that election maps are drawn is by colouring each county by which party won: red for Republicans and blue for Democrats.
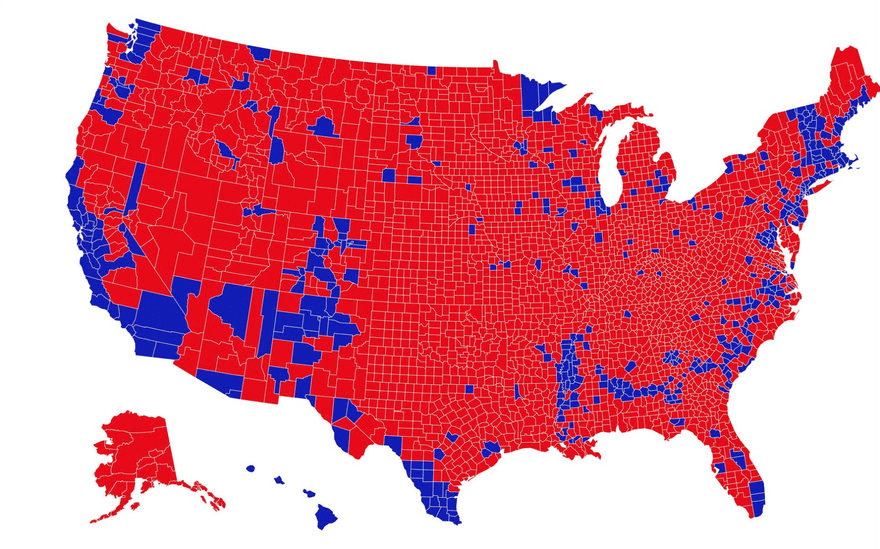
The raw data tells a different story, however, which is impossible to tell without outside knowledge. Another issue with binary mapping is that it views everything as black and white (or red and blue) and ignores that some people in blue counties voted red and vice versa. This goes back to humanising the data and putting the focus on the people behind these numbers. Land doesn’t vote, people do.
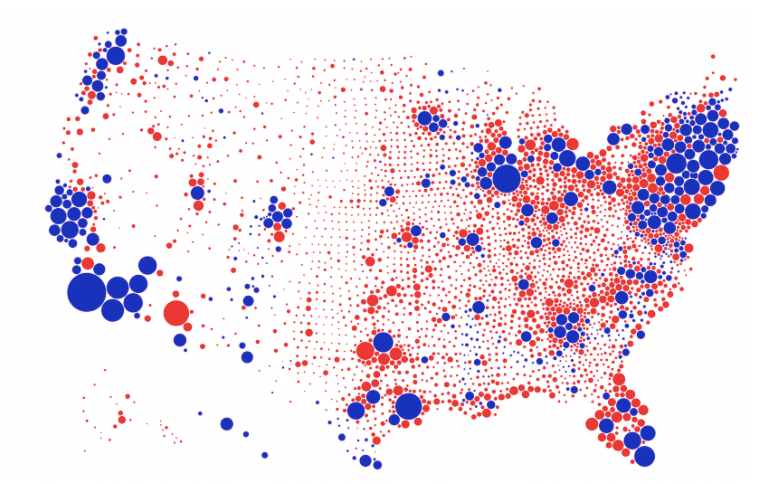
Data scientist Karim Douïeb has created a more accurate way to represent how people vote by using coloured dots that vary in size proportionally to the population of each county. This puts the focus on the people involved and evokes a more complex and representative sense of how people vote.
We can also find data visualisation that suggests misleading patterns or panders to pre-existing prejudices. Actively seek out alternative explanations for the phenomena that you’re seeing displayed in the chart – look for counterfactuals. Be critical and don’t take everything you read at face value. Your readers need to understand the method you used to arrive at your conclusions as they’re reading your work.
It’s often helpful to provide a more detailed look at your process and reasoning. Readers are often sufficiently savvy to consider our work critically, and those who may have reservations about our findings will have more faith in our analyses if they have a clear sense of where we sourced our data and how we crunched the numbers.
It all goes back to humanising the data and thinking ethically about the reasons behind why you’re choosing to visualise data in a certain way.
Visualising Gaza: “We’re not mere numbers”
I visualised the tragedy in Gaza, and a running thought in my brain was: How do I honour the real people in this dataset? How do I humanise these numbers? How do I get the audience to care and understand that this isn’t normal?
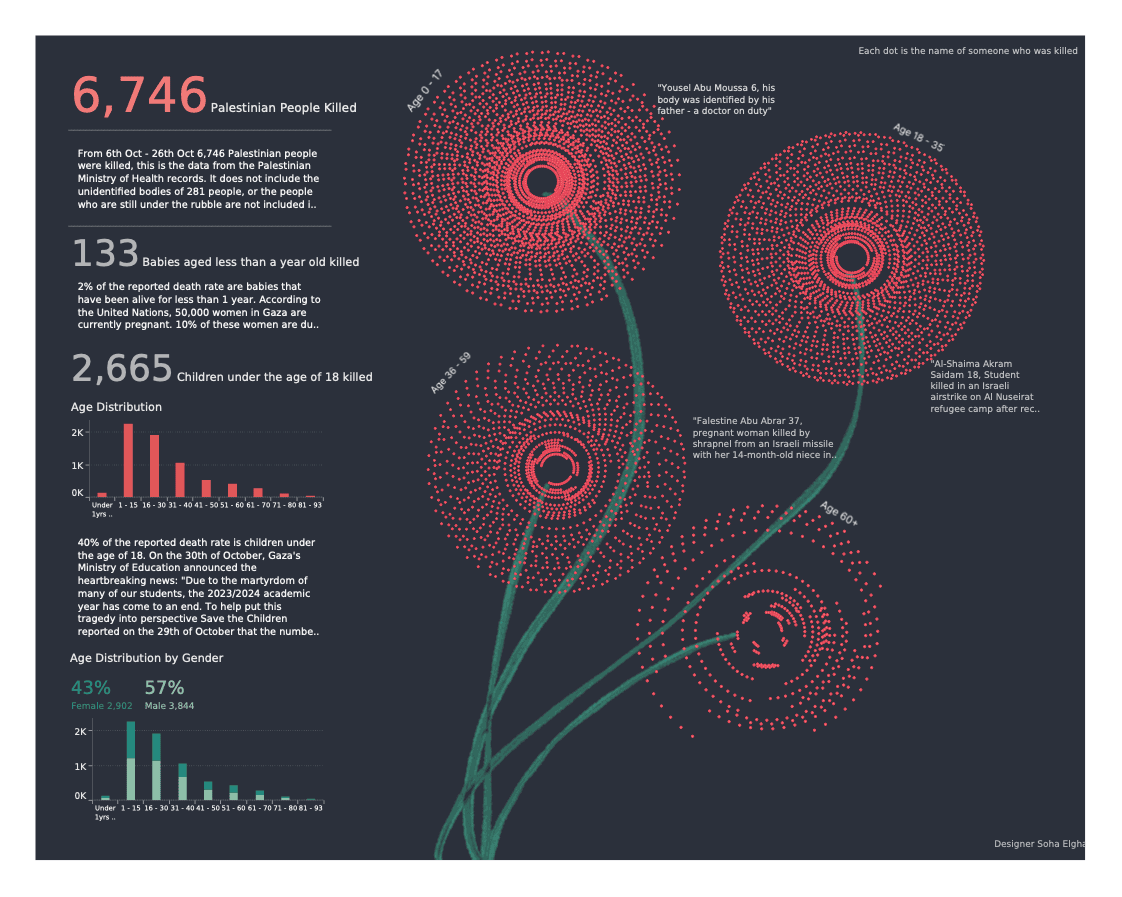
Before I jumped straight into Tableau to create my visualisation, I kept sketching different ideas to figure out my layout and how to do this justice. Especially since I created this in November 2023 when we were still in the midst of the ongoing tragedy, the last thing I wanted to do was dehumanise the people in this dataset, echoing the words of Refaat Alareer: “We’re not mere numbers”. So I decided to visualise it in a disaggregated view, where each dot represents someone, and when you hover over it you can see their name, age and gender – this is someone who loved and was loved, someone who had dreams. I also chose the poppy motif as it is a national flower for Palestinians.
What surprised me the most about the data was the number of children in the dataset. This is why I created age brackets, highlighting that it is children being killed. You can see this in how filled the poppy for ages 0 to 17, and this is emphasised with the breakdown on the left-hand side. In the age distribution, the group aged 1 to 15 has the largest death rate compared to other age brackets (overall, 39% of the victims killed between 6th and 26th October 2023 were children.
How to incorporate ethical considerations in your data visualisations
Visual imagery is important, but as data designers, we also need to remember our ethical obligations. We as human beings are biased; as data analysts especially, we view data as the sole arbiter of truth, believing that numbers don’t lie. We forget that data collection and analysis can be influenced by human biases and paint a small part of the big picture.
We need to ask ourselves:
– What is the data collection process?
– Are there nulls?
– What are we excluding/including in the ETL (extract, transform, load) process?
– How are we visualising this information?
In addition, we should consider missing data. Often data tells the story from one perspective, and there’s often missing information we don’t take into consideration. For example, we could be looking at educational performance based on standardised testing and university acceptance rate, but that would overlook important ethical concerns when missing data and contextual factors are not included, such as socioeconomic status, SEN inclusion, teacher quality or student mobility. By not providing a comprehensive understanding of the educational landscape, the data visualisation may inadvertently perpetuate existing stigma or unfair judgements against those students in schools categorised as low-performing.
As data designers, it’s important to research a topic and not just look at that spreadsheet of data given to us. Let’s continue to educate ourselves and confront our biases that may have an impact on how we view and decide to analyse the data. Let’s focus on the people and not just the numbers.
Thanks to Soha for sharing her experiences of working with the data that emerges from social crises. We believe that data done right has the power to drive change, whether in policymaking, purpose or practical action. To find out more, speak to us today.
About Soha Elghany

Soha is a data visualisation designer with a focus on humanising data. She specialises in creating data visualisations based on real-life stories to get people to engage with the data. You can see Soha’s visualisations on Tableau Public and on Behance.