Richard Silvester
June 28, 2024
This year’s Outlier landed in Chicago, and Martina and I were thrilled to connect with the global data visualisation community.
Hosted by the Data Visualization Society, this Outlier served to galvanise collaboration, transparency, and ethics at a time when we really need it. As technology evolves more rapidly than even many tech companies have predicted, its impact on business analytics, data visualisation, and data teams grows increasingly complex. Of course, the discussions on- and off-stage spanned pivot tables, data prep, lollipop charts, AI automation, generative art, and more. But the real challenge remains how best to connect people.
The Outlier line-up featured talks from the likes of NASA, Urban Institute, McLaren Racing, and UNICEF, offering a well-rounded knowledge base. Here are my 3 key takeaways:
This year’s Outlier theme was positive disruption.
Data visualisation is now more integrated across sectors and roles, enhancing strategic problem-solving and user-centred design. Whether encouraging healthy eating or helping a racing driver shave off milliseconds, the need to consider audience, context, and feedback loops is critical.
Nick Desbarats set the tone for the 3-day event in Chicago with the line, “In order to break the rules, you must first know the rules.” As tech evolves, it allows us to break the rules—but we need deep domain experts to know what can be broken and what should be preserved.
Highlights:
– Regine Abos: Habitual framework and vernacular design
– Kevin Ford: Emphasising business problem-solving over dashboards
– Aleszu Bajak: The importance of ‘exquisite documentation’
The shift towards low-code/no-code/automated solutions is making lighter work, and in turn enabling us to be more inventive and creative. This allows for rapid production of engaging data-driven tools, stories and experiences from sometimes complex data sets.
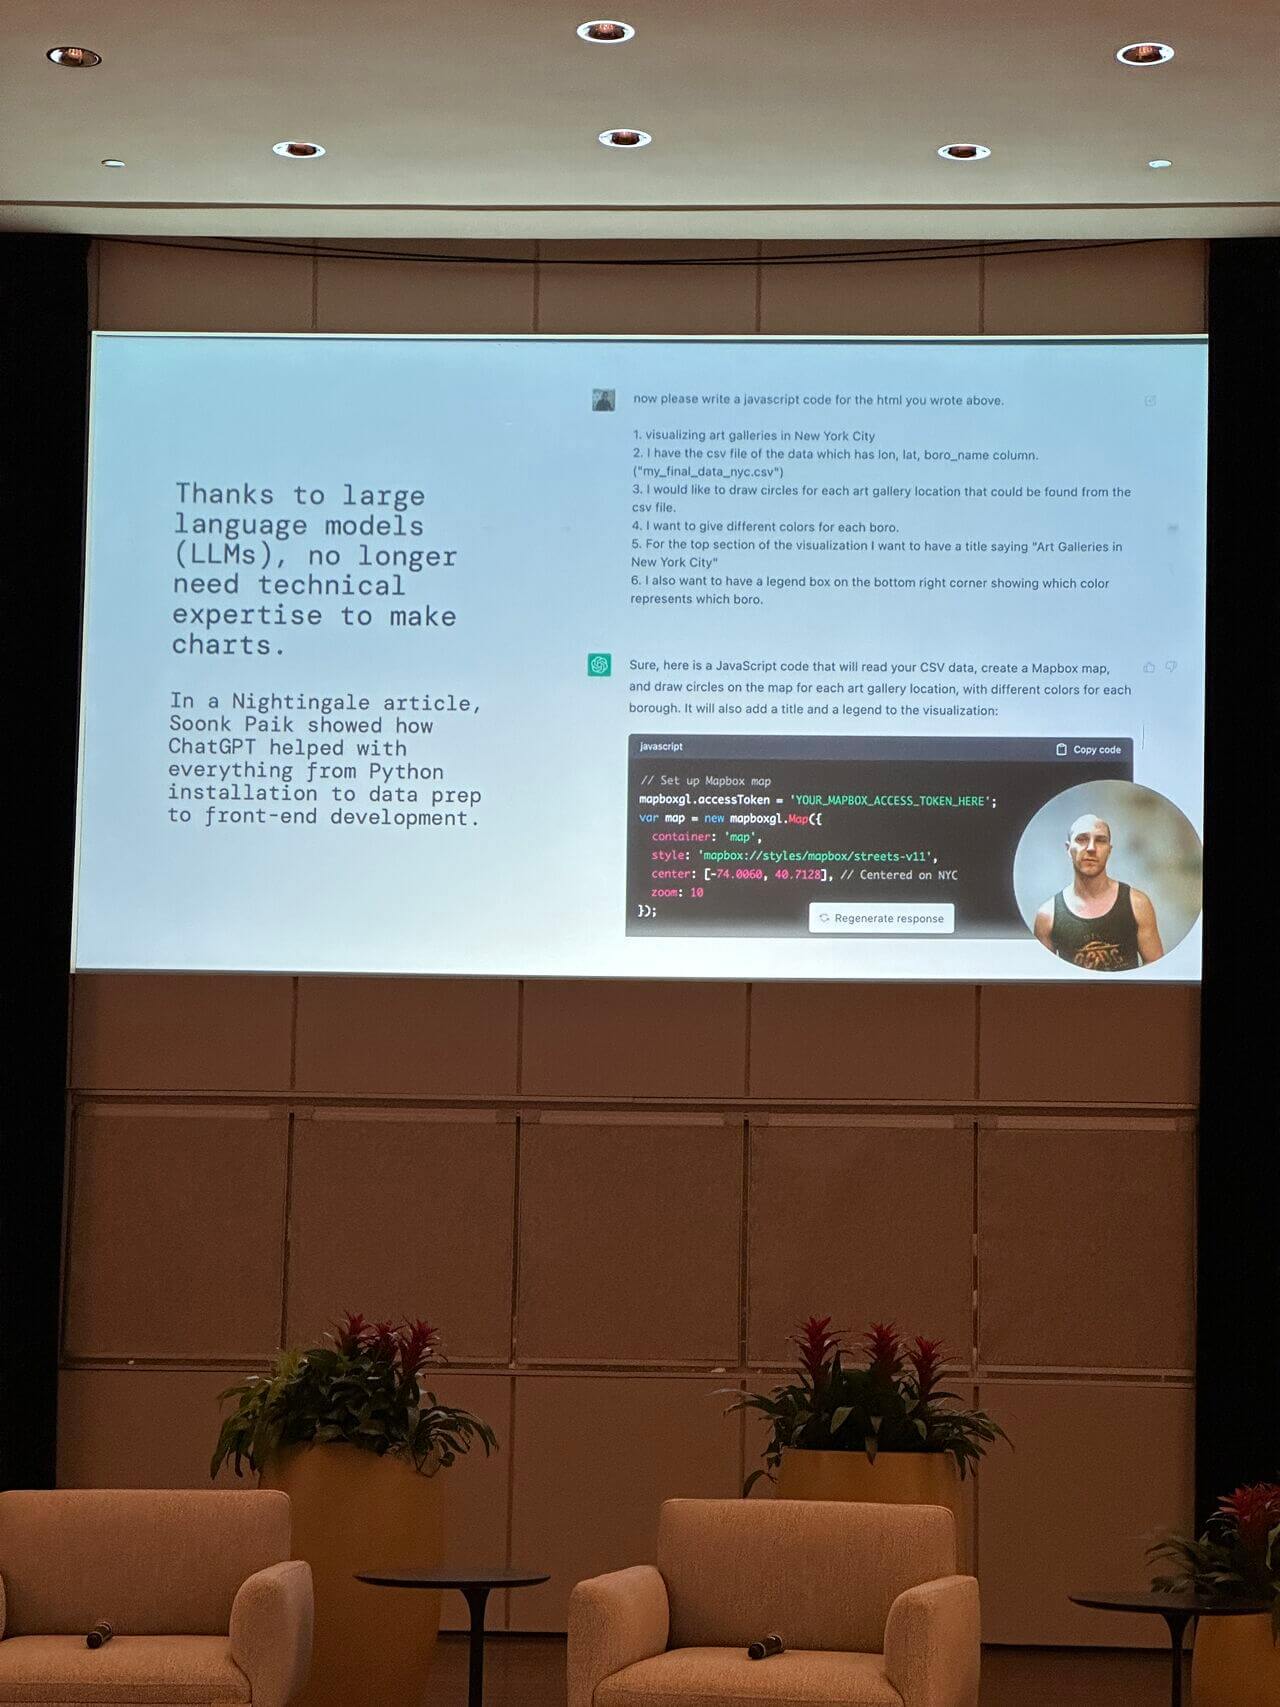
Last year, I was sceptical about AI, marred by surface-level reading. Of course, concerns about job losses, creativity, and control are still real. I recently completed an MIT course on designing and building AI products and services, guided by experts like Thomas Malone and Barb Wixom, and it has brought new colour to my perspective. I’m now fascinated and encouraged by the vast use cases and potential of AI for good.
Ultimately, data visualisation can play a critical role in enhancing trust, traceability, compliance and safety.
Highlights:
– Matthias Stahl & Rudi O’Reilly Meehan: The power of Svelte kit and GSAP library animations
– Valentina D’Efilippo: Efficient vectorizing with Adobe Fresco for Britannica’s Encyclopedia Infographica.
– Nick Desbarats: How might subject matter experts feed AI solutions to make automated data-led content more accessible? (Imagine a tool presetting chart tricks such as chart annotations, bait-and-switch charts, or slow reveals.)
Joining over 400 mission-driven professionals, and finally meeting the Data Visualization Society board members in person was a personal highlight of the trip.
The data community shares the responsibility to uphold values and best practices. Ethical considerations in AI and data usage are crucial to ensure our visualisations remain unbiased and inclusive. Leveraging community spirit and networks to safeguard trust and set standards is essential.
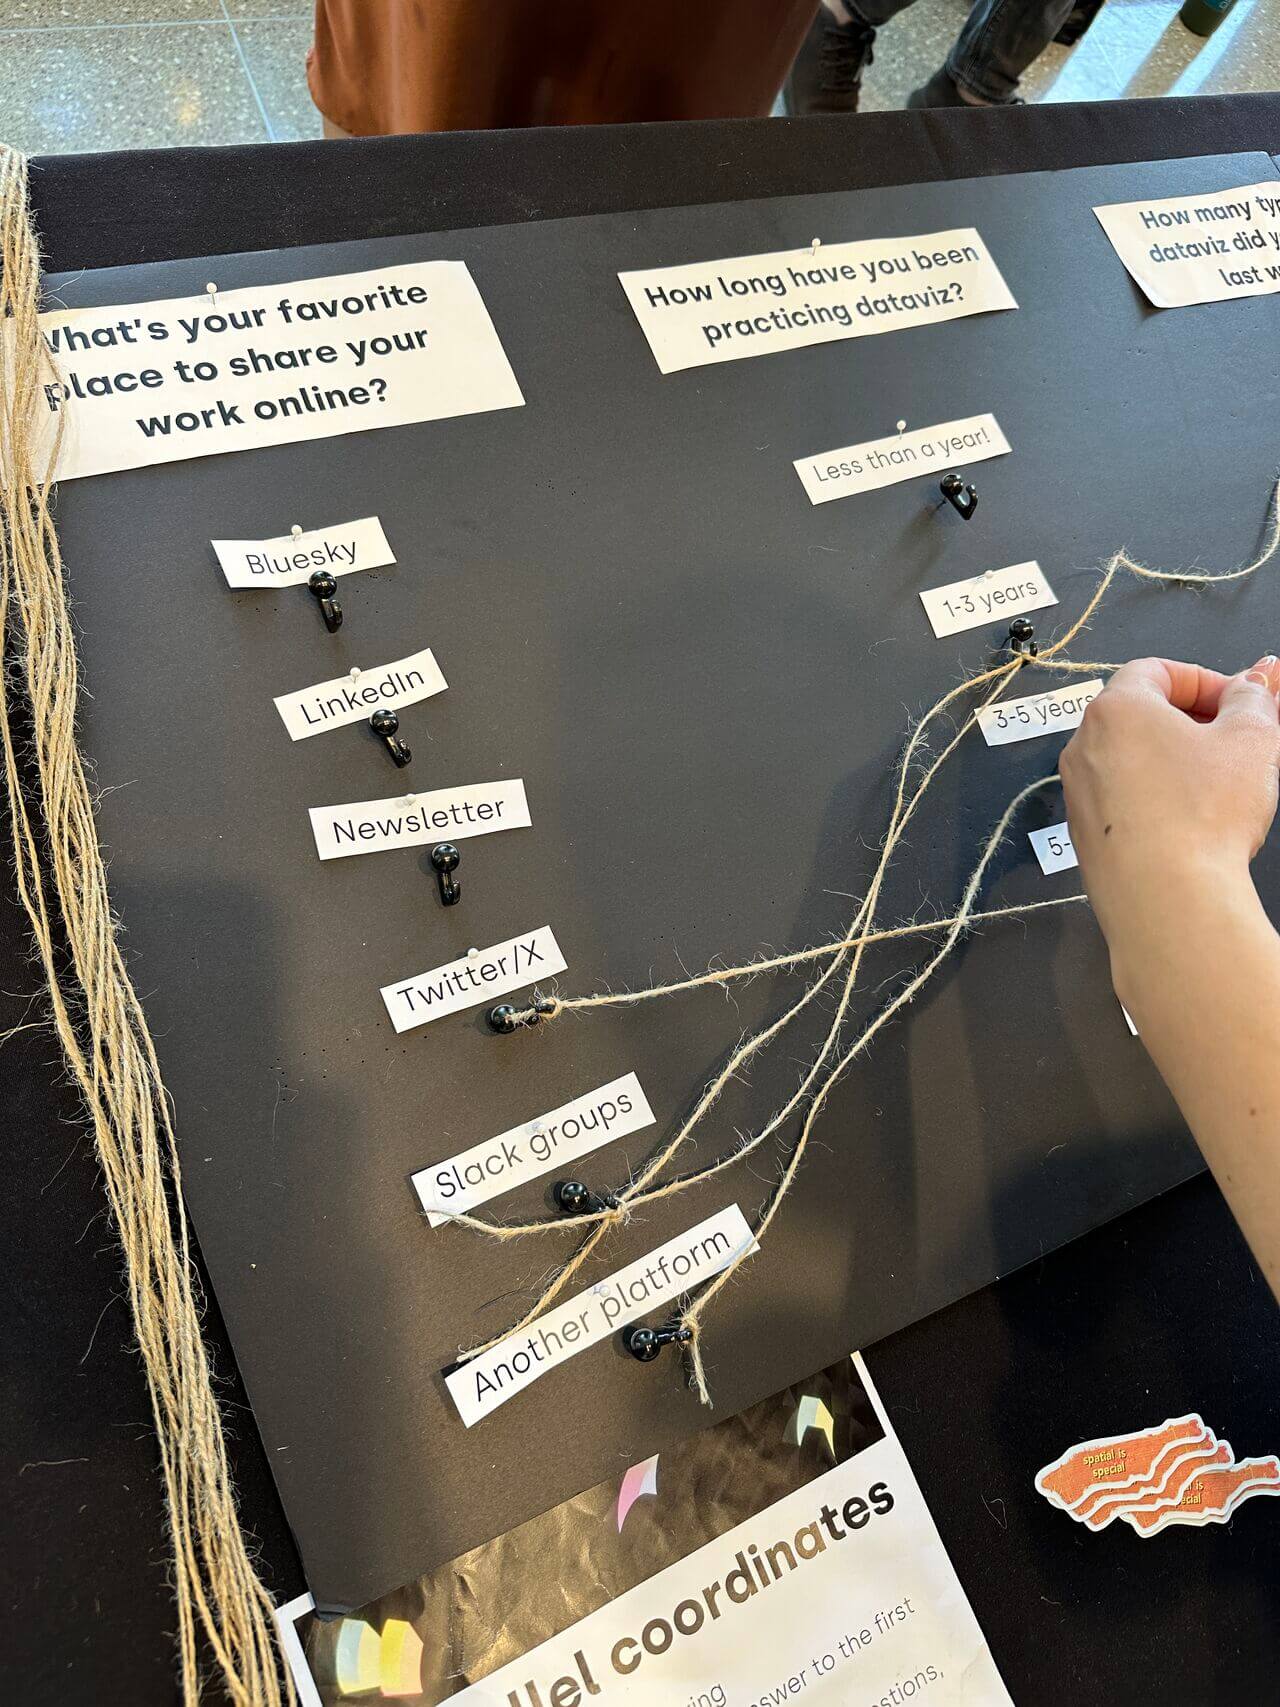
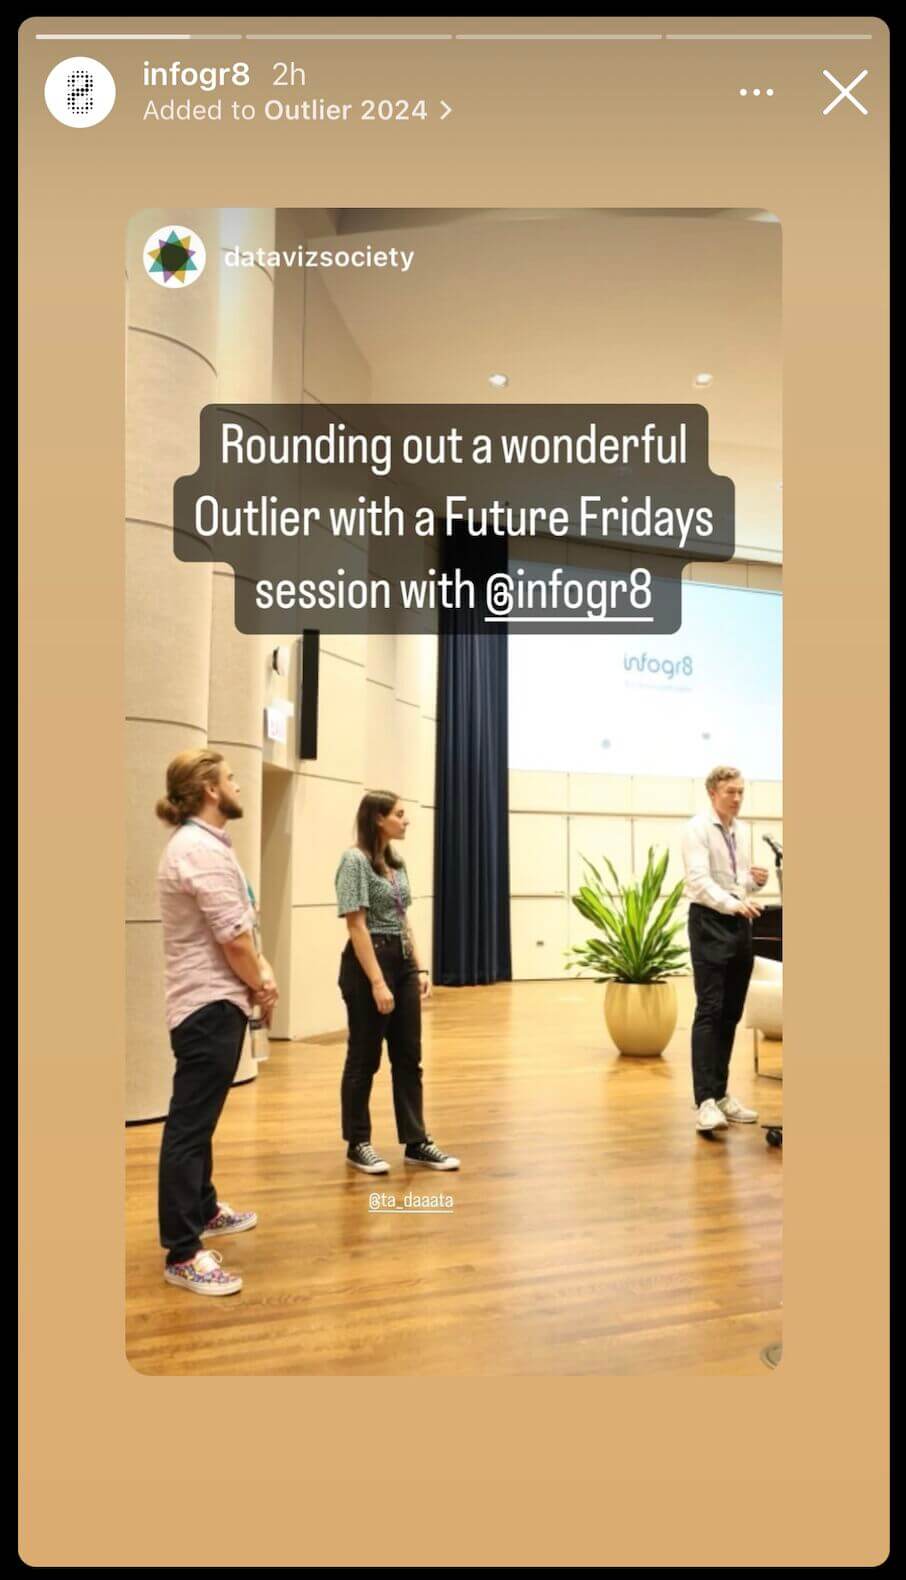
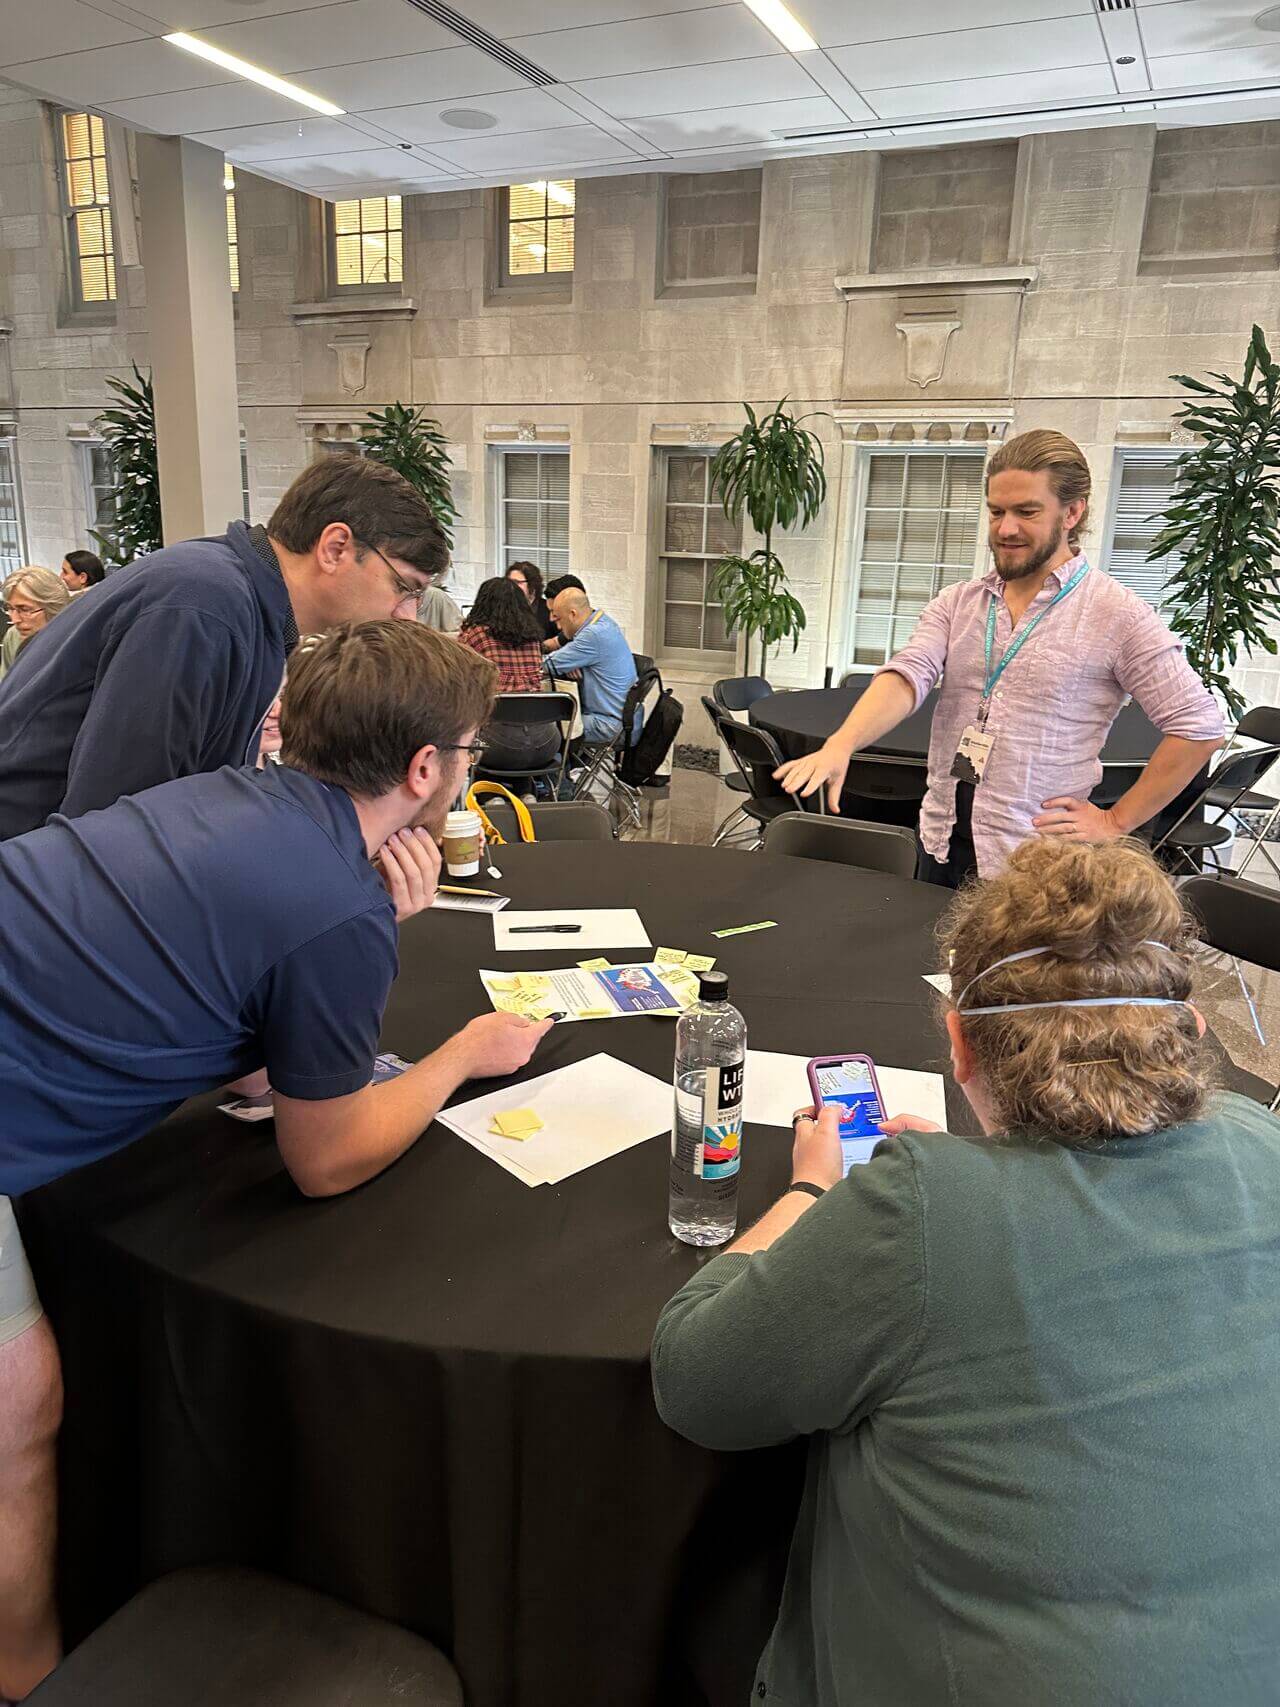
At Outlier, our very own Information Design Lead Martina hosted the latest edition of FutureFridays, our data innovation lab, alongside luminary Eli Holder.
This was the first ever FutureFridays to be hosted in a physical space, exploring the theme ‘Charting Truths: Why Correlation Implies Causation’.
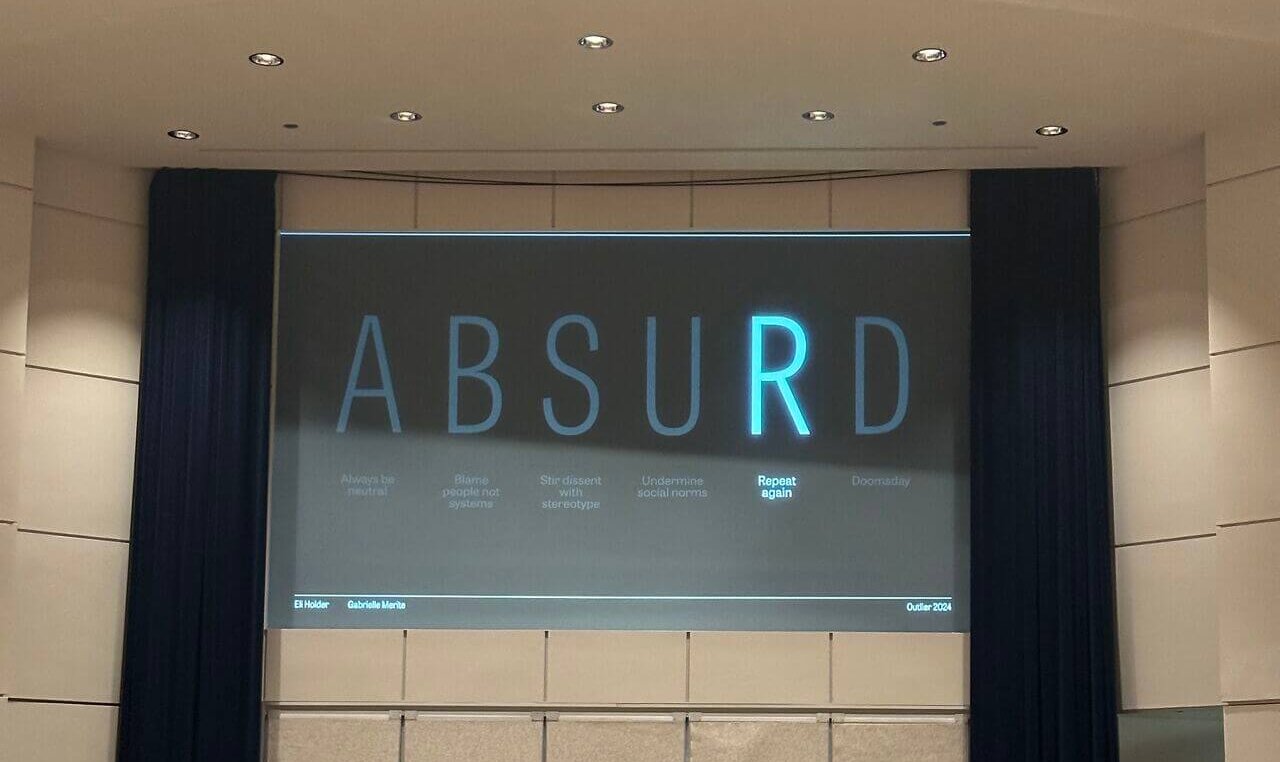
Our attendees delved into real-world examples of misleading data visualisations, asking ourselves (to quote Eli) “what we see and what we actually see” and investigating how half-truths and stereotypes can emerge. Then we considered alternative narratives that highlighted the truth behind the data and closed those doors to false interpretation.
Highlights:
– Eli Holder & Gabrielle Merite: How to undermine humanity with data viz
– Emilia Ruzicka: Tactics for gender inclusivity in data reporting (“When in doubt, write it out”)
– infogr8’s FutureFridays with Martina Zunica & Eli Holder: Navigating the ethics and power of visualisation
Next stop, Outlier Miami in 2025!
Soho Works White City,
Television Centre,
101 Wood Lane,
London,
W12 7RJ