Isabelle Bittar on function over perfection: An agile framework for delivering dashboards on a tight timeline
Reading time
Category
While there are many articles out there on UX principles and best practices for designing impactful and visually appealing data dashboards, few discuss the teamwork and coordination needed to effectively deliver a BI project. Or just to make a solution work in time to address users’ immediate (sometimes urgent) needs.
It’s crucial to design dashboards centred around a great user experience, but it’s also important (if not more so) to plan the behind-the-scenes efforts of logistics and coordination to ensure that the project is delivered on time and when users need it most.
The stats reveal a sobering reality in the IT project landscape: 66% of tech projects end in partial or total failure. This underscores the challenges of meeting deadlines, staying within budget, and fulfilling user expectations. In my experience, setting the pace and embracing agility has been my key differentiator in creating analytical products that adhere to time and resource constraints while surpassing client expectations.
Here are the three most important aspects of this approach:
- Beyond client vs. developer: Emphasising the partnership
There needs to be a partnership between the business and technical delivery teams that goes beyond the ‘client vs. developer’ mindset. - Function over perfection: Value-driven delivery
The focus of project delivery should be on what brings the most value to the users, which includes prioritising the delivery of incomplete but functional parts over ‘perfect’ ones. - Rapid prototyping: Fast feedback and user empowerment
Getting anything in the users’ hands as fast as possible, even while it’s a work in progress. Whether it’s a sketch, part of a dashboard that has been developed, getting feedback while developing helps course-correct quickly and slowly onboard super-users on how to champion the dashboard.
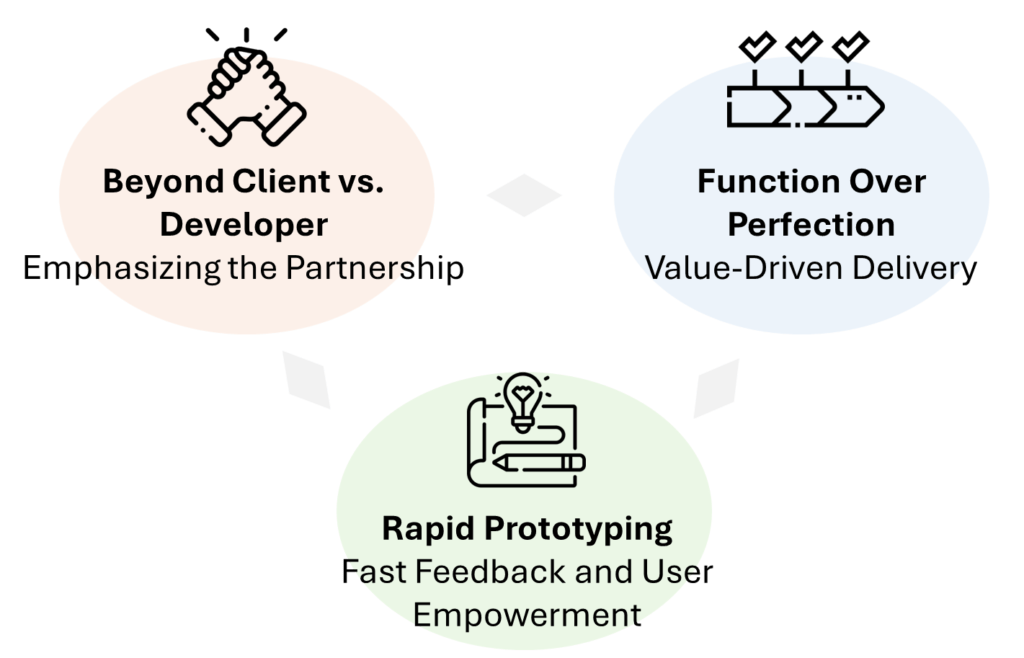
The three key vectors in data dashboard agile development (Isabelle Bittar)
In this case study, I outline how I leveraged this agile development approach in delivering an urgent dashboard to a talent acquisition team. The team required reporting on their performance and support in assessing and improving their operations following an uptick in hiring activities. This scenario was especially business-critical, as a significant portion of the roles were vacant, raising concerns among upper management and shareholders.
The project itself spanned four phases, which I cover in more detail below:
- Understanding the client’s initial needs through a discovery call
- Developing a low-fidelity sketch to align with the client’s vision
- Working in synergy with the client through rapid development
- Completing the initial development and preparing for hand-off
Case study: Building a talent acquisition dashboard for an energy company on a tight timeline
My client was a time-pressed team that needed a dashboard built – and fast. “We’re running out of options, and we don’t have much time!” was the prevailing tone over an unplanned but urgent video call with the Chief Human Resources Officer (CHRO) and the Talent Acquisition (TA) Director of one of my client companies. During the meeting that followed an earlier board assembly that Thursday, they briefed me on their current situation: they needed to quickly develop a dashboard, but their internal IT team had refused to support them because of the tight timeline and unharmonized data stemming from an ongoing migration to Workday.
Attempting to navigate their frustration and anxiety over the current situation, I gathered a preliminary list of their requirements for the project. Having been referred by another department within the company (a team I had previously worked with), I had no prior experience with this group. Despite my concerns about achieving a mutual understanding of the development needs, I was confident that with the support of one of my colleagues, we could deliver ‘something’ to address at least most of their urgent requirements. This was one of those cases where something was better than nothing – prioritising function over perfection – and I agreed to take on the project.
At the end of the call, the TA Director agreed to share with me their data working files within the hour so that I could gain a better understanding of their data landscape and to identify team leads who could support me further in their domain knowledge. We scheduled a follow-up meeting for the next morning to establish a plan from there.
After a quick review of their data, I started sketching a low-fidelity wireframe in Figma that I could use to discuss my understanding of the type of solution they were seeking the following morning. Although imperfect, it got the ball rolling with all parties and helped clarify some key elements with the identified TA leads.
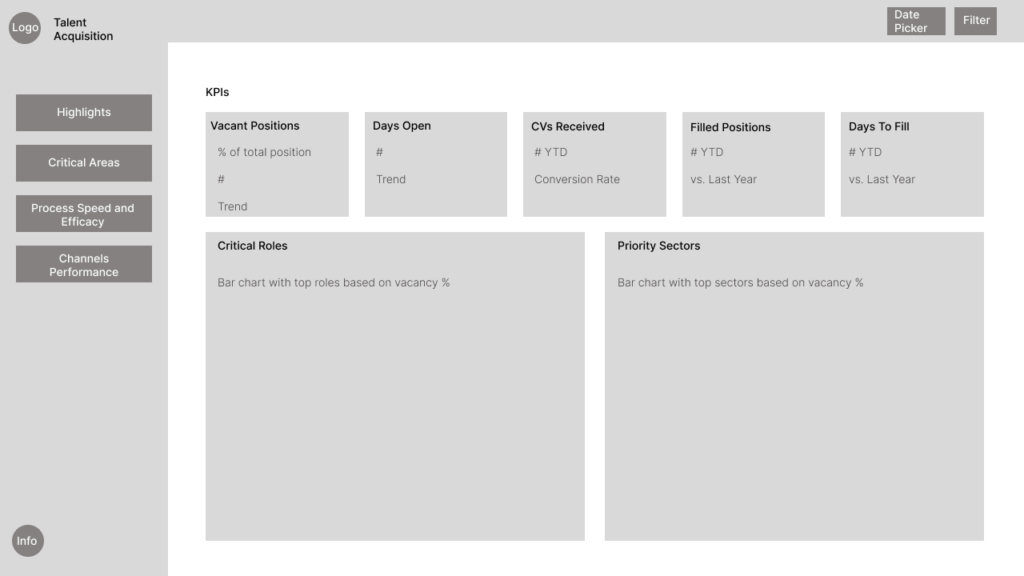
Low-fidelity wireframe sketched in Figma for the project (Isabelle Bittar for KI Data Science)
An agile approach to collaborating with the client
Following the Friday morning meeting, I got my colleague up to speed on the project and we started working together on the data model in Power BI. We also started to calculate the most important indicators to share our results with the TA leads to ensure our calculation methods were aligned with theirs.
My colleague and I established a routine with the other TA leads of meeting every morning at 7am (before the official start of everybody’s workday) to review our progress and discuss any necessary clarifications. Initially, I had extended this invitation only to the TA leads, but the TA Director and CHRO also attended these early meetings due to their overall concern and the project’s urgency. They wanted to make sure that things were happening (as they didn’t know me or my colleague very well yet) and be present to address or resolve any issues or dependencies.
By Tuesday of the following week – within a week of receiving the initial brief – my colleague and I released the first functional sections of the dashboard to the TA leads. During that morning meeting, we reviewed the operational parts of the dashboard, allowing them to begin exploring, while highlighting the sections that were still under development. The initial release impressed the TA leads, and the TA Director and CHRO were relieved to have a working tool in their hands. This was a case where rapid prototyping wasn’t only good for us to capture feedback, but a winning factor in gaining the user’s confidence and building our partnership.
Following this, we began collaborating in a shared Google Sheet proposed by the TA leads, in which they would document any required modifications and we could track the status of items needing clarification. This document also served as a log for all requested further developments and their prioritisation. It was nowhere as official as a proper project setup on Jira or another project management platform, but it proved effective with this group.
In each morning meeting, my colleague and I presented the latest version of the dashboard, quickly highlighting changes for the TA leads to test. At this point, our partnership with the TA leads was becoming stronger and it was no longer us (the developers) versus them (the client).
By the end of the second week, the TA Director and CHRO had most of the information and visualisations they needed to report back to senior management. Discussions were heated at that level about the organisation’s overall workforce situation, and the CHRO and TA Director constantly gave feedback to our group (the developers and TA leads) on the types of questions they were receiving to further identify ways we could better present the information to respond to their questions and concerns.
The second to fourth weeks of development were extremely demanding, but it enabled us to develop an awesome analytical product. And, as a group, we each learned so much from each other’s expertise and grew a lot together.
By the fourth week, the majority of the dashboard was completed, with any remaining modifications and additional requests being addressed from a continuous improvement perspective. By this time, we were able to start breathing again and move at a more sustainable pace.
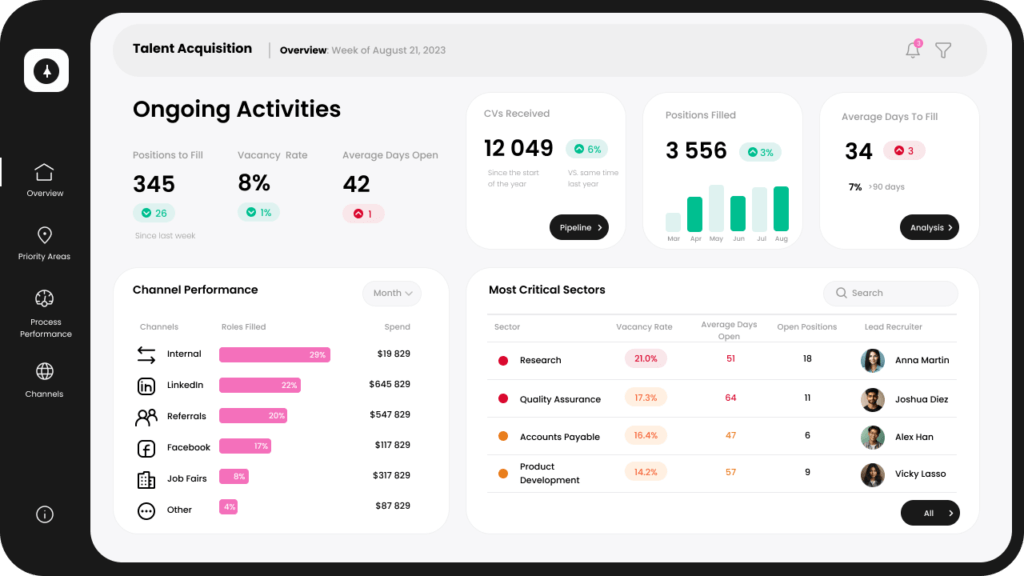
Talent acquisition data dashboard by the fourth week of development (Isabelle Bittar for KI Data Science)
Building a data-driven team within HR
Today, the dashboard is a key resource for the talent acquisition team. It helps them report on their operations, prioritise their efforts, and assess their overall performance. The team still brings improvements to it on a continuous basis, and my colleague and I are currently transferring development activities to their internal IT team to enable them to become self-sufficient.
The TA team is now viewed as the data-driven team within HR. Having calmed the initial concerns of upper management and the shareholders, the TA Director and CHRO are also now equipped to provide proactive insights on overall workforce movements and their implications for the organisation.
While this project was built on working data files, it also laid the groundwork for the data architecture needed in the mid to long term for the entire HR function. It also served as a proof of concept for the value of analytics within HR, helping to secure the necessary IT resources.
The importance of action over inaction in dashboard development
For me, this project highlighted the essential lesson that agility and timely delivery are more critical than perfection in meeting business needs. Direct collaboration with end-users provided immediate feedback, enabling quick fixes and fostering an understanding that sometimes good enough is better than perfect. This approach not only met the urgent needs of the client’s talent acquisition team, but also demonstrated the value of prioritising impactful solutions over flawless execution.
In the end, the project showed the importance of action over inaction and the effectiveness of focusing on high-value, low-cost solutions from the start. It proved that a collaborative, user-focused approach could overcome common IT project pitfalls, laying a foundation for future data-driven initiatives within HR. The experience reaffirmed the belief that success in technology projects hinges on flexibility, partnership, and a keen focus on the users’ immediate needs.
Isabelle’s approach to BI dashboard development aligns nicely with infogr8’s way of working, which we call ‘agile everything’. At infogr8, we have a world-class team of designers who know the ins and outs of creating class-leading data dashboards. Contact us to learn how we can help you do more with your data.
About Isabelle Bittar

Isabelle is an independent BI consultant who supports her clients in elevating their data analytics and AI capabilities. She has industry and consulting experience, aiding international firms in health, finance, aviation, retail, public health, energy, IT, construction, and telecom.