
Tobias Gremmler
3D Animation
Using motion capture methods, Tobias Gremmler collected movement data from two kung fu masters creating a seriously beautiful animation. We’re not going to say anything else, just watch the (amazing and incredible) video.
Kwinten Crauwels
Microsite
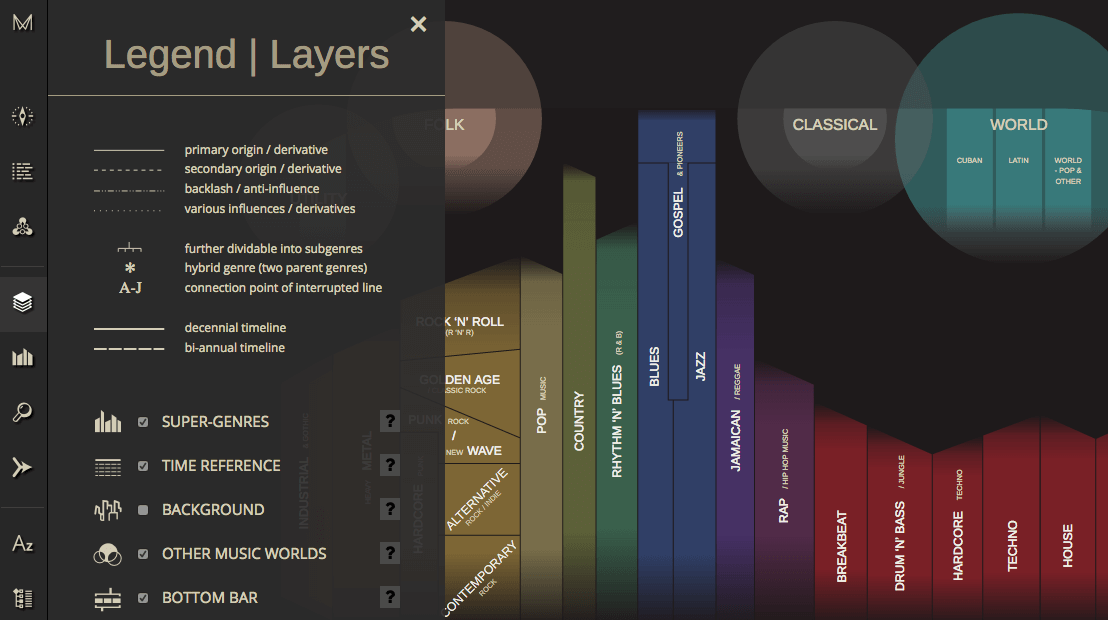
You’ve seen it before, and you’ll probably see it again but we think Kwinten Crauwels has cinched this one – the ultimate interactive family tree of music genres. We weren’t entirely sure to start but on zooming in, you start to realise the complexity of this piece. Each genre is thoroughly researched and Crauwels has also dictated the methodology behind the research providing some intense background to how this was pieced together. The deeper you dive, the more you’ll find – you’ll even find a playlist, available on both Spotify and Youtube, for each part of this intricate web of music history.
How far is too far? The distance workers commute to cities – mapped
The Guardian
Infographic
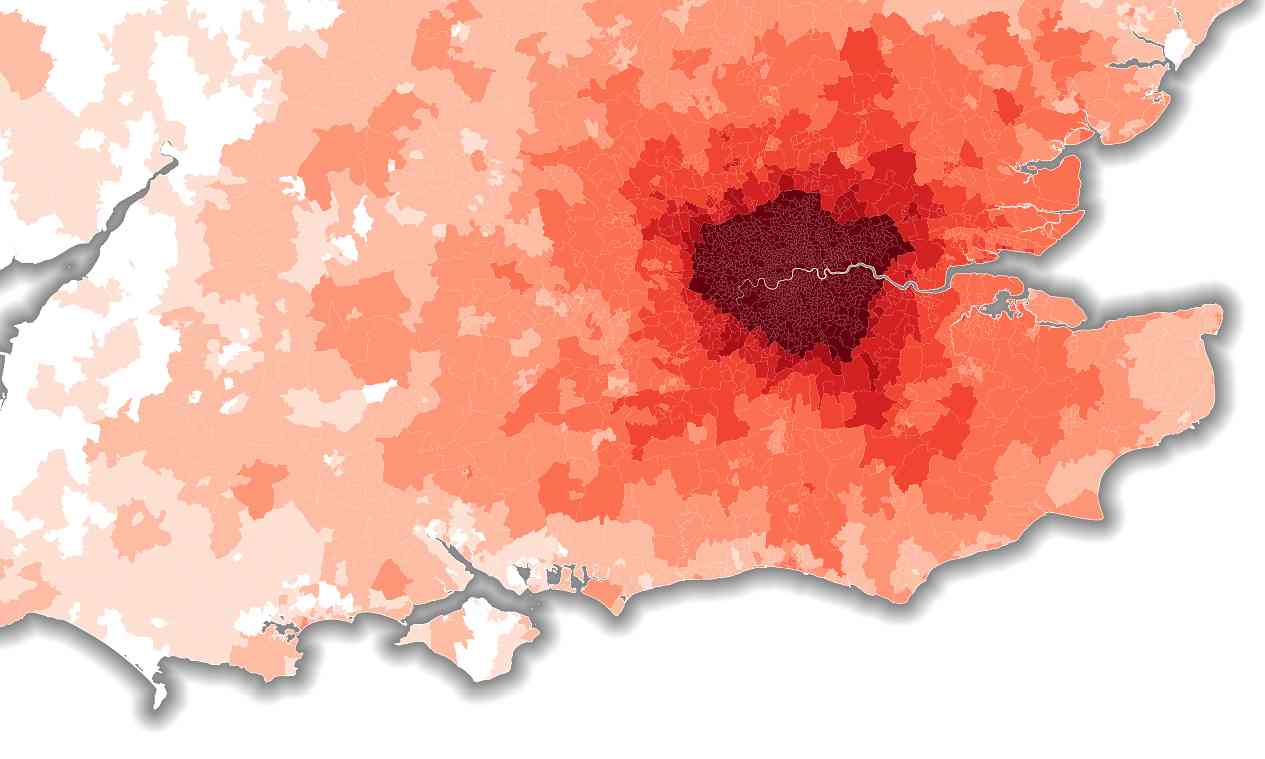
Greater London extends almost as far as the M25, but its reach is much greater when you consider the number who commute to the capital from further afield. The Guardian has produced a series of choropleth maps which show how people move around the county to get to work in key UK cities, revealing where a city begins, and where it really ends. London, it seems for some, stretches all the way from Newcastle to Cornwall.
The making of me and you
BBC
Dashboard
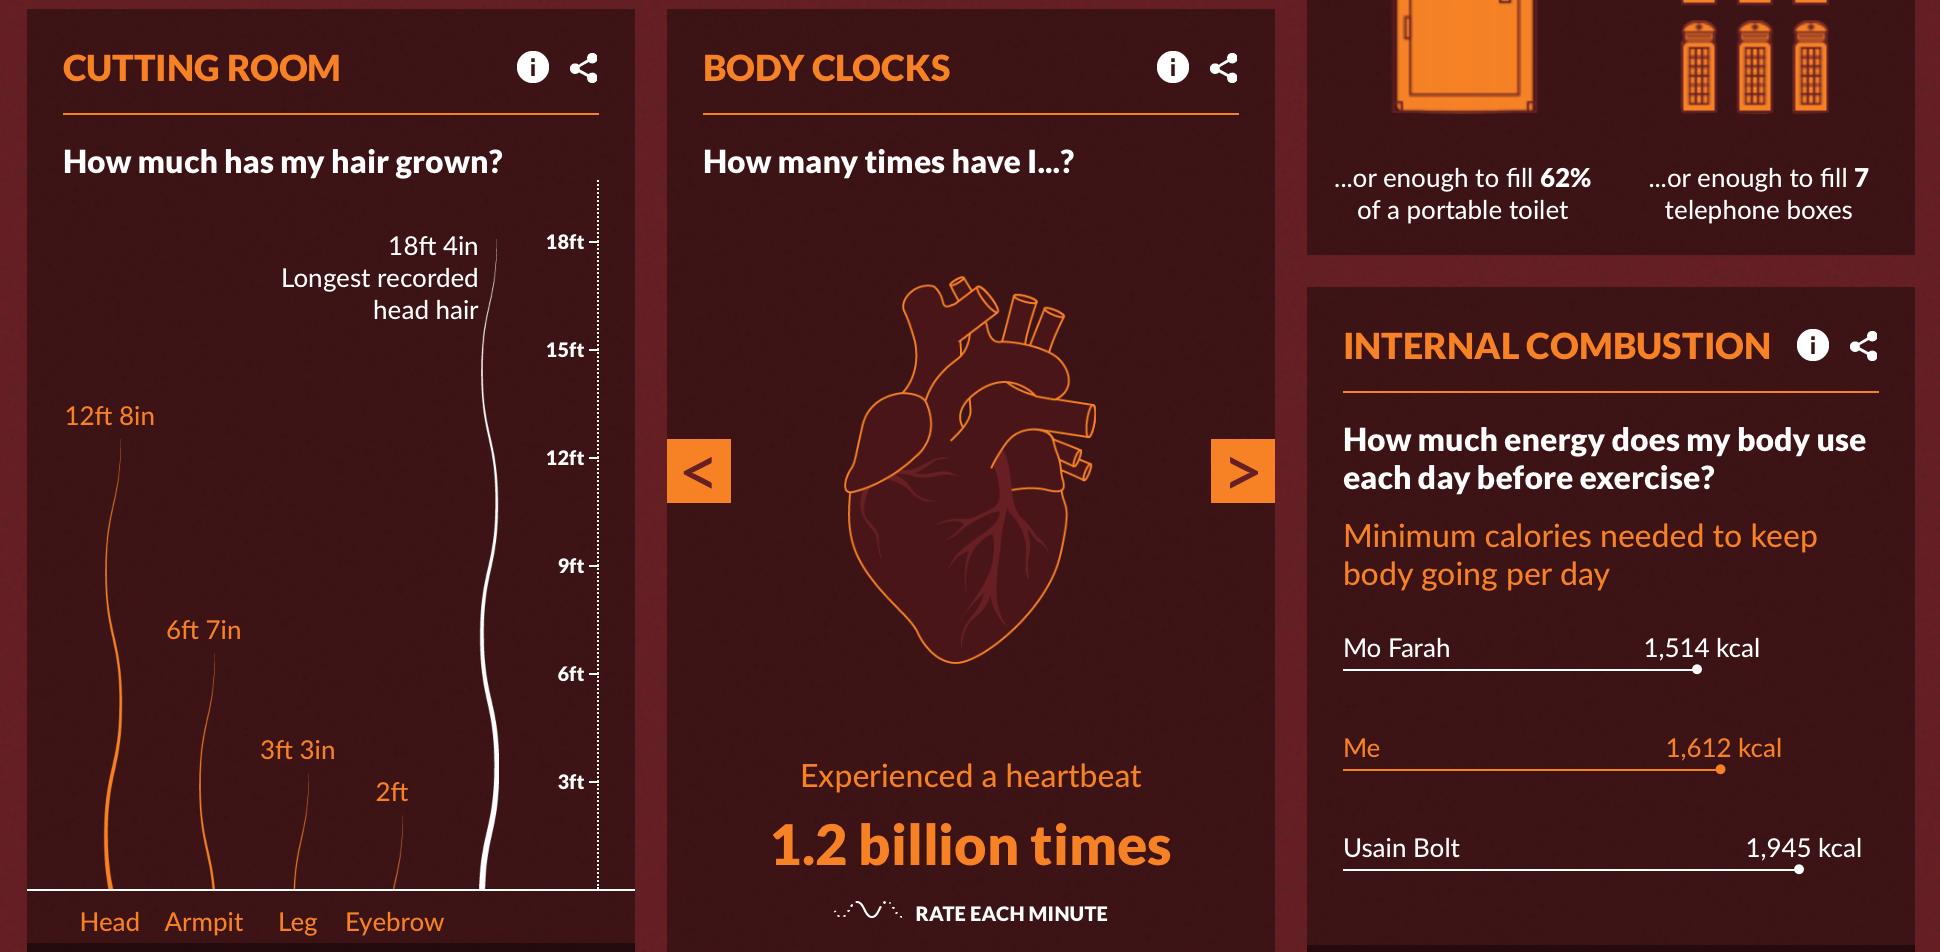
The human body is an incredible piece of engineering by nature. There are more cells in your liver than there are stars in the Milky Way, the heart of someone in their early thirties will have beaten over one billion times, and we will have produced over 8,088 pints of sweat. The BBC have produced a personalised dashboard were we can enter our age to see the journey our own body has got through during our lifetime. If you also want to know how many pints of farts you are responsible for, head right on over and enter your details to find out.

Data-driven micro site
Column Five
While some of us don’t admit to being massive fans of African-American music, but this interactive guide showcasing some of the unsung heroes of the genre really struck a chord with us in the infogr8 office. Produced by Column Five, we are asked to select an artist by loading their vinyl onto a turntable, giving us chance to sample the music and read about them in detail. Although only Sister Rosetta Tharpe is selectable at the time of writing, more vinyls are promised in future to keep our eardrums happy.

Human emotions are incredibly complex and what type of ‘basic’ emotions humans can express is still a point of contention. This visualisation was inspired by the creator Dr. Paul Ekman and the Dalai Lama about the science of emotion. Designed to be a visual journey through the world of emotions, the visualisation presents you with Anger, Fear, Disgust, Enjoyment and Sadness where you can explore each, its states, actions and more.
Leicester’s incredible run: Started from the bottom, now they’re here
The Financial Times
Data Blog
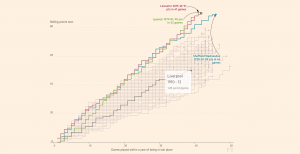
By now, you could hardly fail to hove noticed that the Premier League has a new winner, one that only 12 months ago were staring relegation in the face. But Leicester City bounced back, big time. No other team has managed to recover is such spectacular style throughout the entire 117 season history of English league football. Ipswich and Sheffield Wednesday came close to similar achievements in the past, and now thanks to John Burn-Murdoch at the Financial Times we can put these amazing feats into perspective. Using the modern three-points-for-a-win system, charts have been created so that seasons can be compared through the ages. Even those of you that could not give a toss about football will be sure to get a kick out of this.
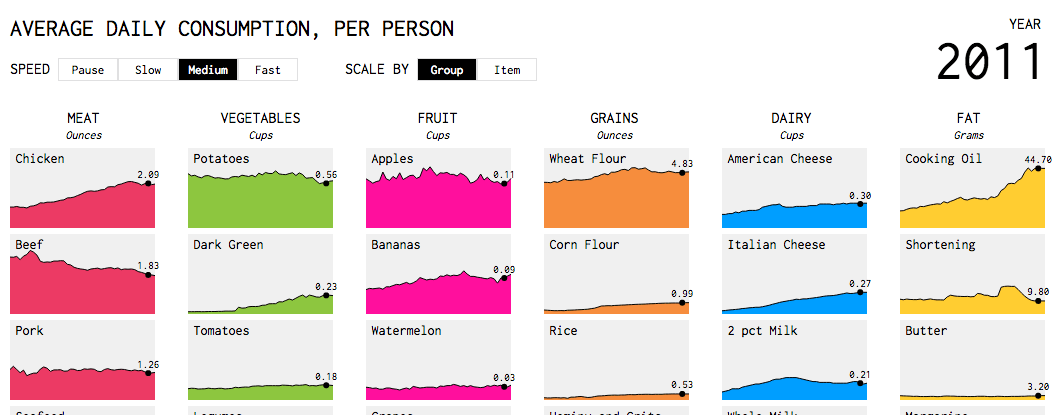
Nathan Yau
Data visualisation
After seeing the Open Data’s project on the changing British Diet, Nathan Yau couldn’t help but wonder about the changing American diet. He created this visualisation and found incredibly interested trends regarding butter and margarine, cooking oil, dark green vegetables and the battle between whole milk and low fat milk.