 Insight
Bringing the fun factor: Gamification and playfulness in data visualisation workshops ✨
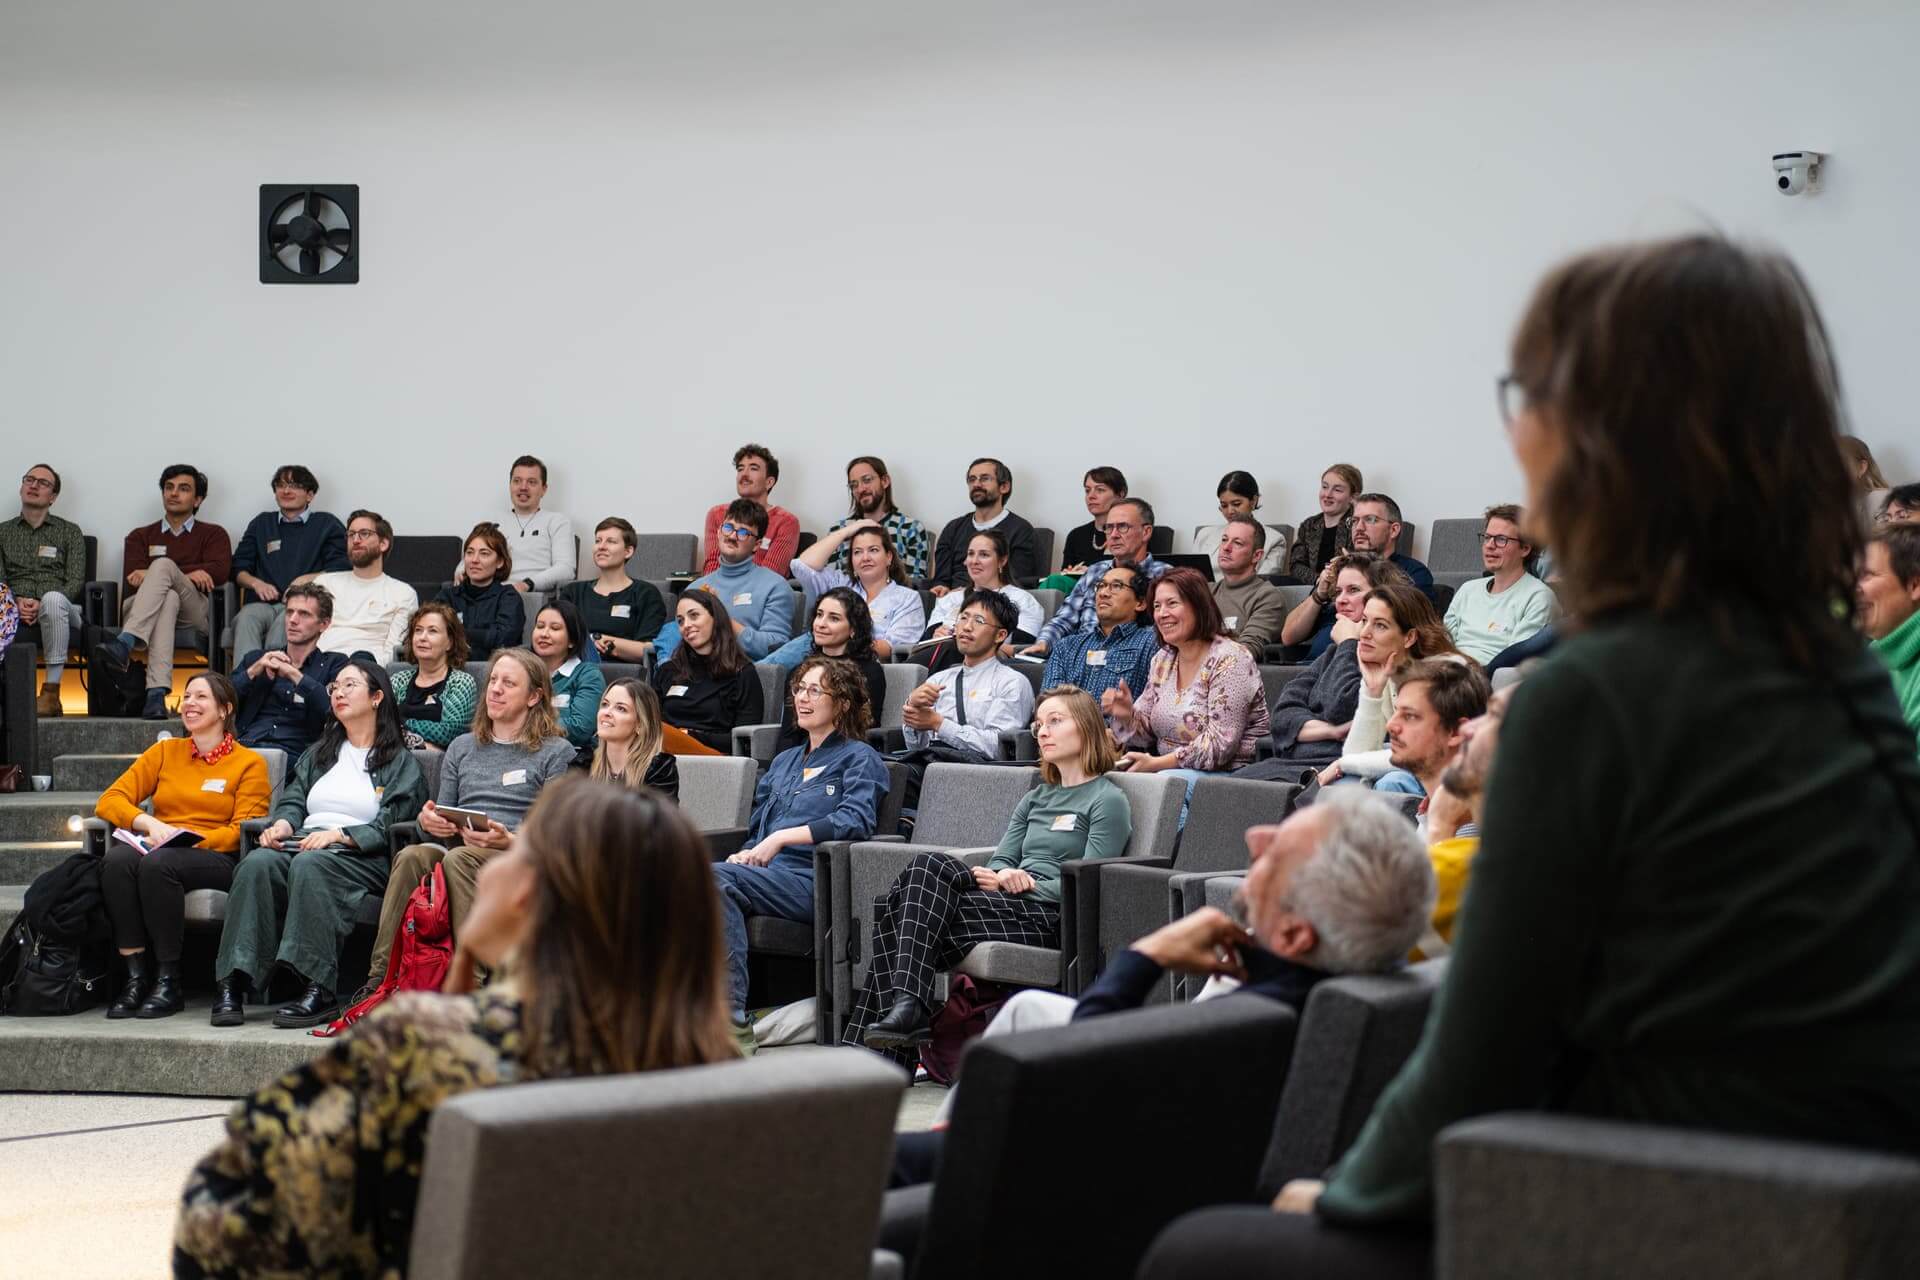
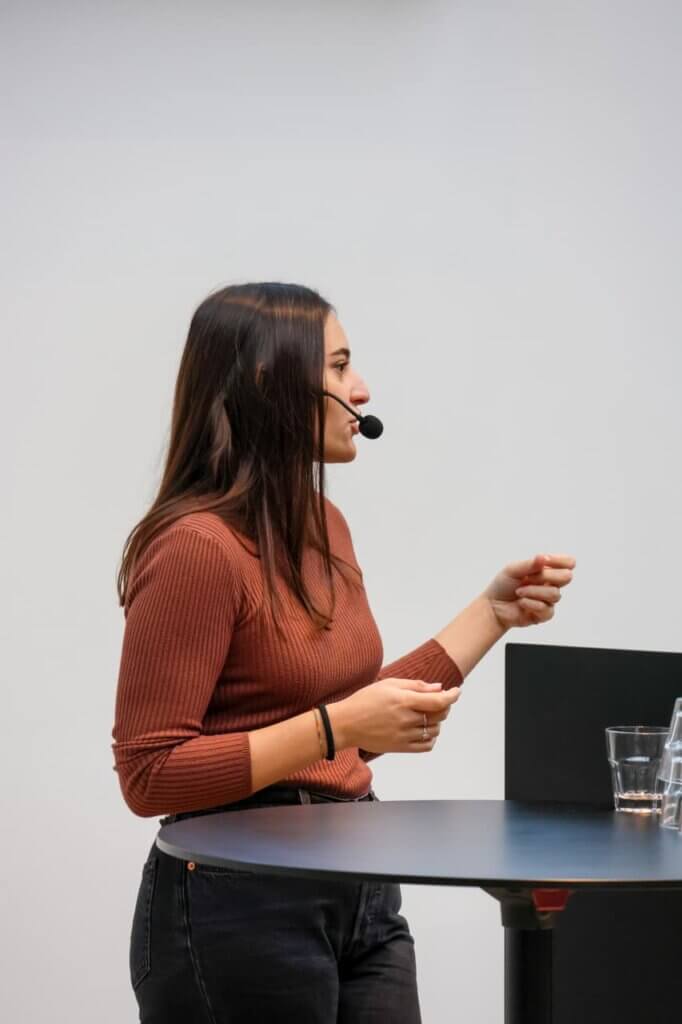
On 15th November I spoke at the information design and data visualisation conference Cest-La-Viz 2024 in Utrecht, the Netherlands, organised by Graphic Hunters. I wanted to showcase my experiences with boosting creativity in data design workshops, and I was delighted to join such an amazing panel of dataviz specialists.
The key message of my talk? Introducing the fun factor, be it through playfulness or gamification, can lead people to learn more and faster, encourage dialogue and knowledge sharing, and of course make the entire data experience more pleasant for everyone involved.
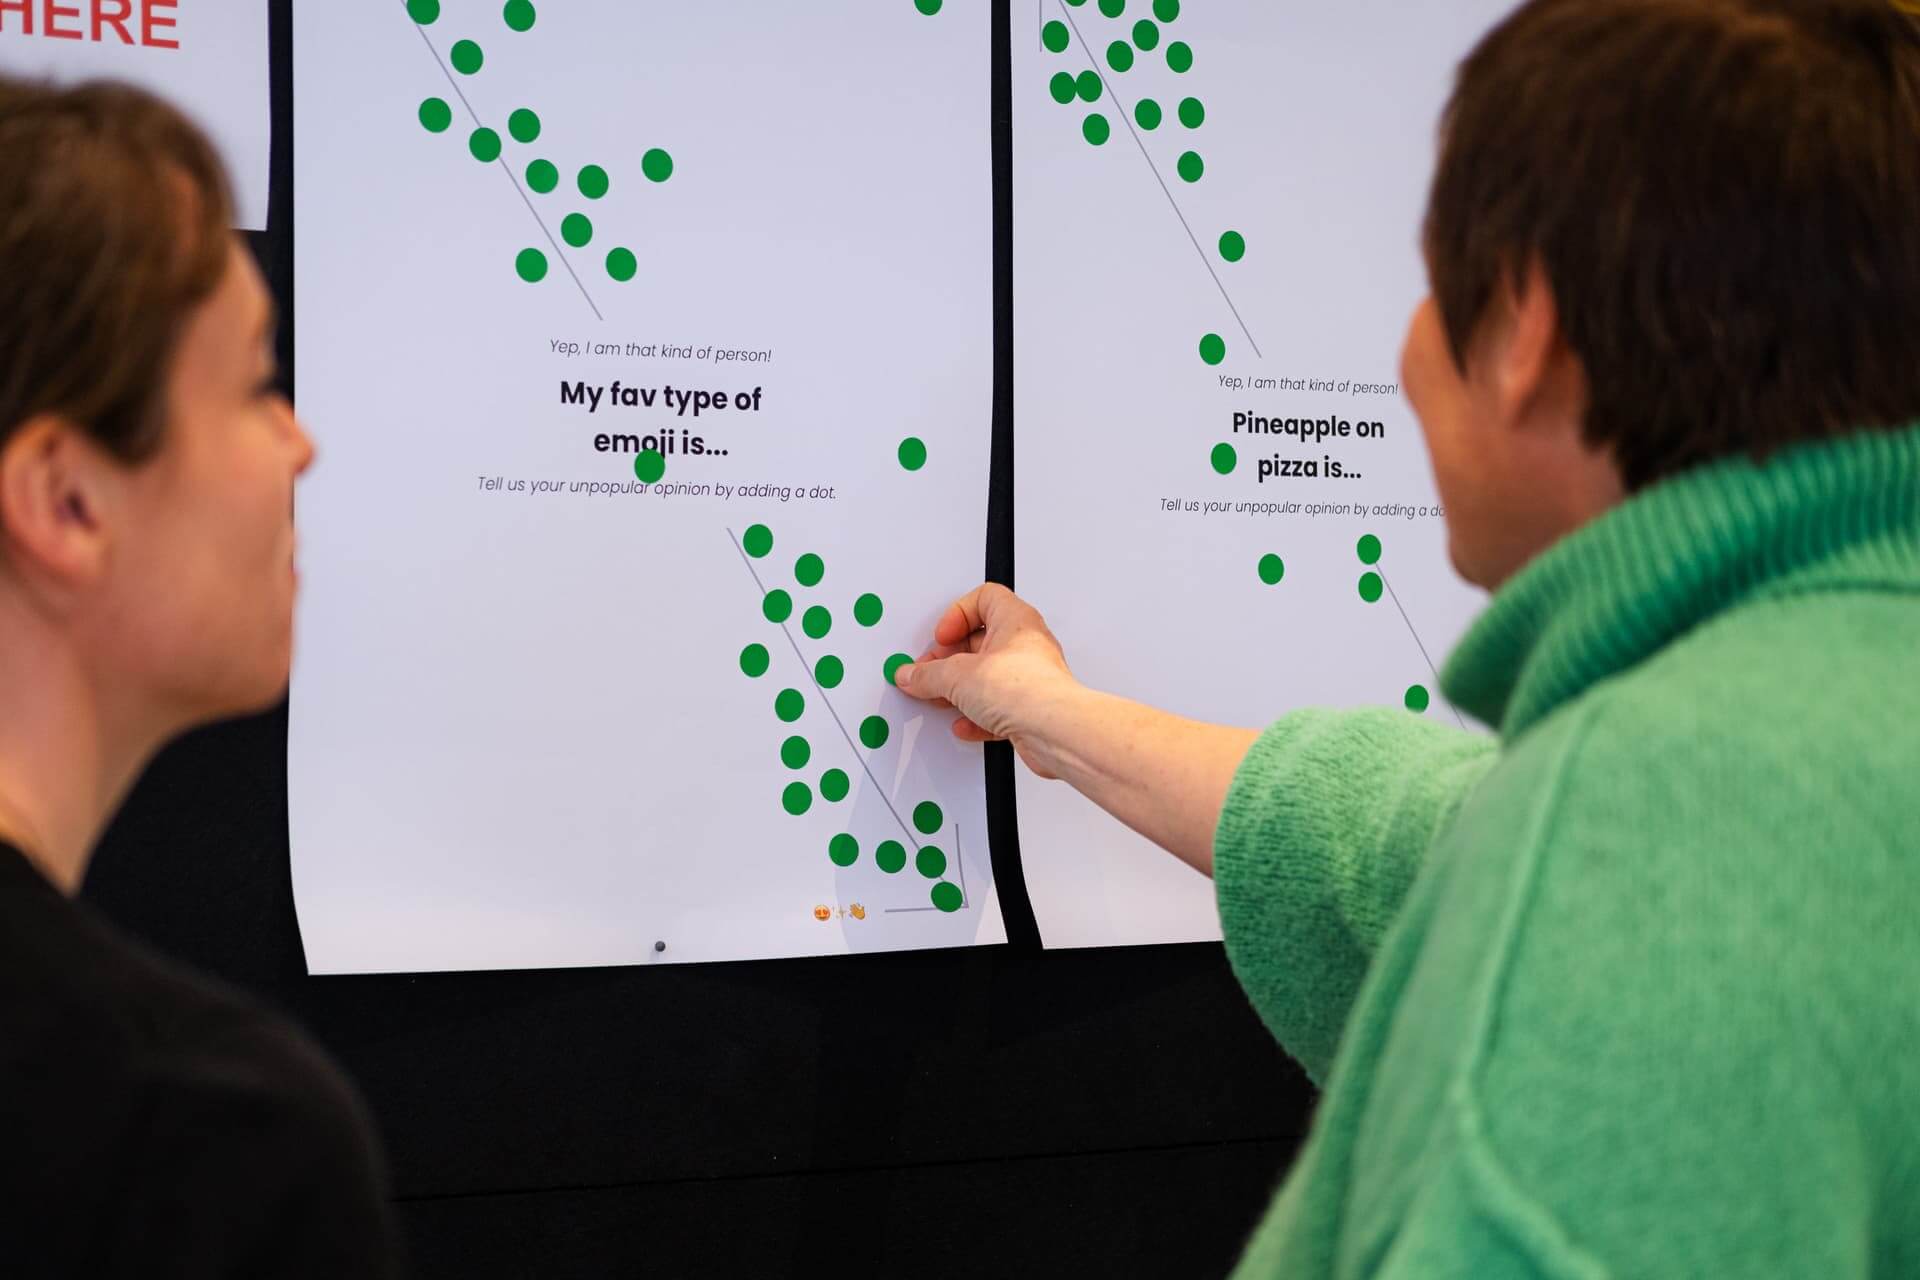
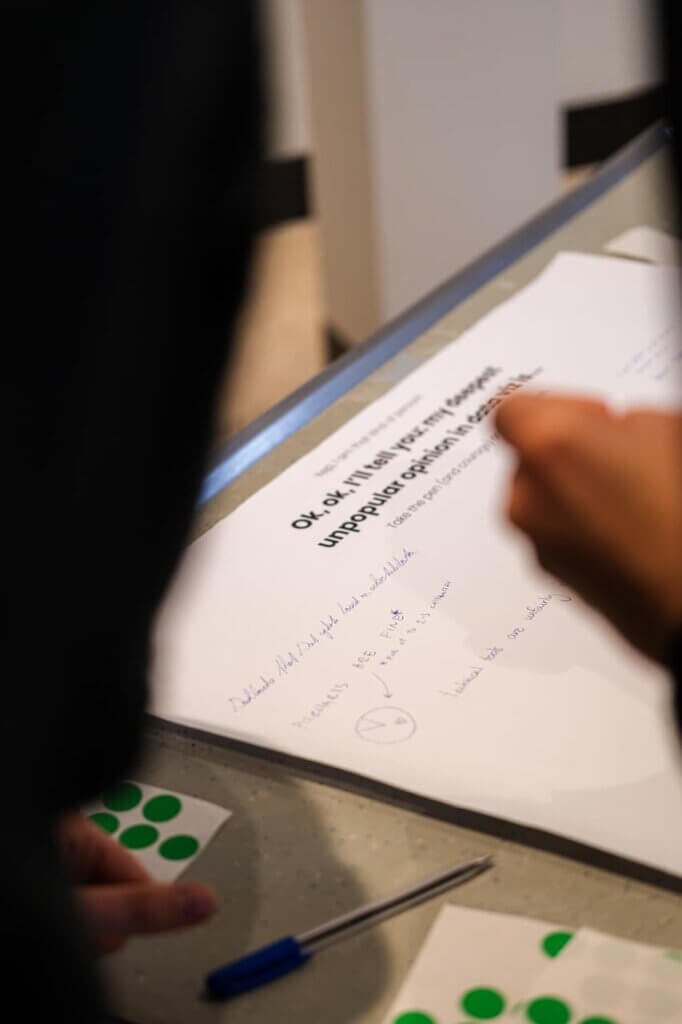
I also wanted to bring the fun factor to the talk itself, asking the audience to raise their hands and interact with me. And at the end of the talk, I suggested that they not only trust my ideas and guiding principles, but to actively test them out with a series of information design games I had prepared on the floor below.
You can watch the full talk below, or read on for a full recap:
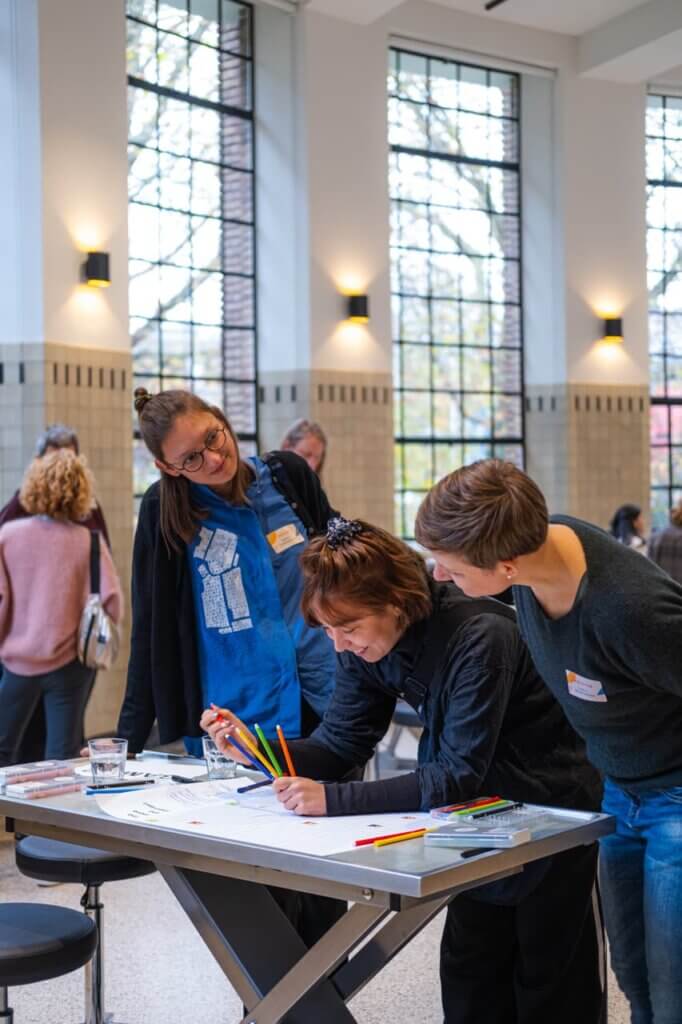
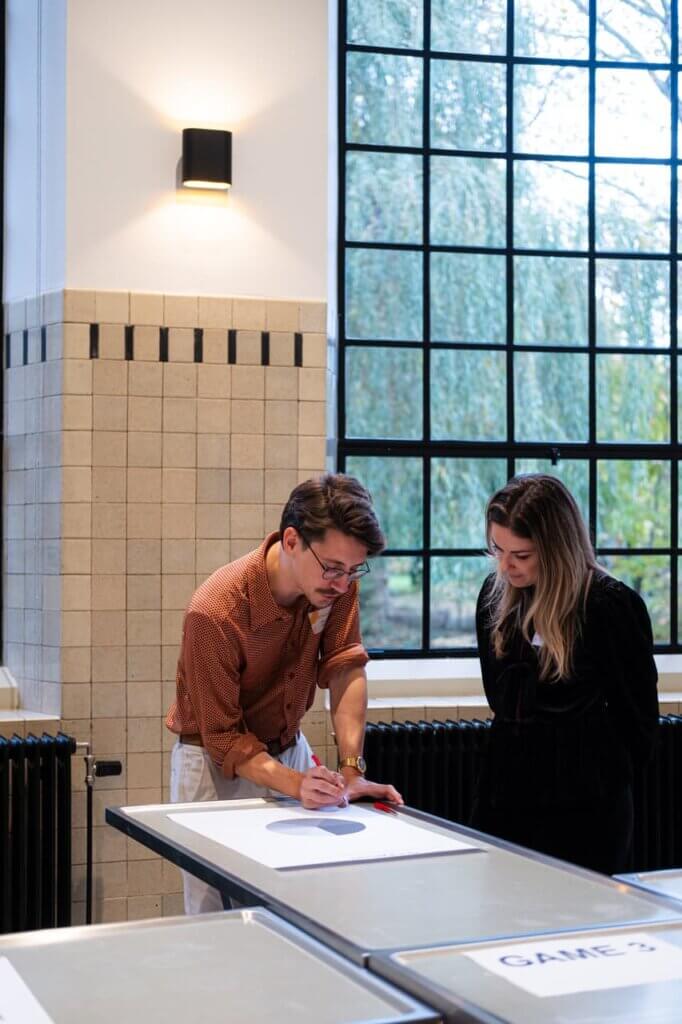
Here’s a recap of my Cest-La-Viz talk, with some thoughts on how you can bring the fun factor to your own data design projects. A huge thank you to Chesca Kirkland and Filip de Blois for the photos!
- Image credit: Chesca Kirkland
- Image credit: Chesca Kirkland
- Image credit: Filip de Blois
- Image credit: Chesca Kirkland
5 aspects to consider when hosting a data visualisation workshop
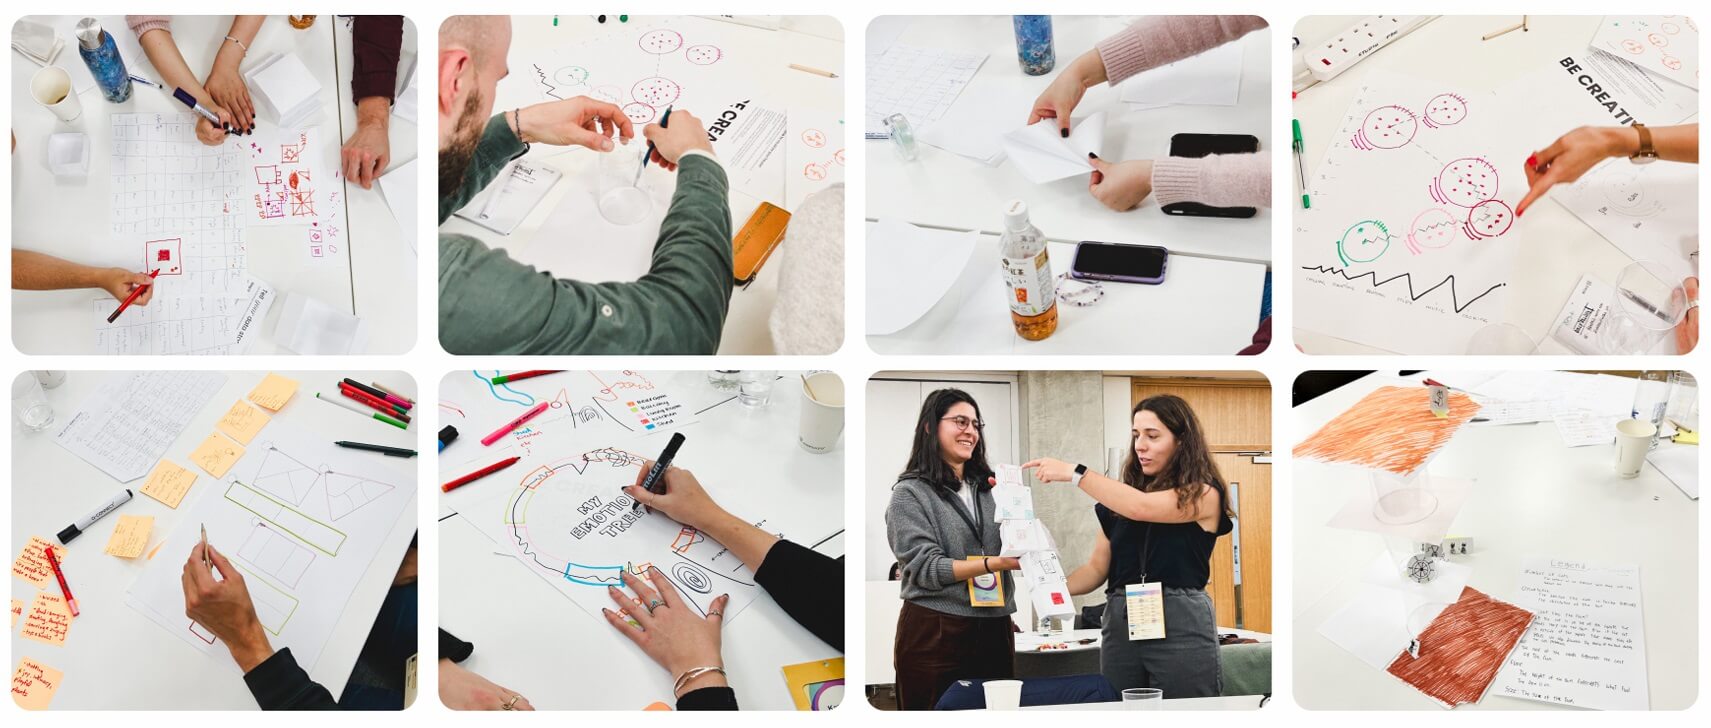
Over the past two years, I’ve had the joy (and sometimes the chaos) of hosting information design workshops for everyone from corporate suits to creative types.
Based on those experiences, here is an overview of the most important elements to consider when preparing a data-centred creative workshop:
1. The audience – Are they involved in data? How old are they? Where are they from?
2. The goal – What is the main learning I want them to take from the workshop?
3. The tools – Is the workshop online or in-person? Are we working in a digital or analogue way?
4. The method – What shape will the workshop take?
5. The fun factor – How can we add some creative spice into the mix?
This last element will always be personal, but to me the fun factor encompasses several key aspects of workshop design and delivery:
– Keep the event informal (this is not a lecture).
– Make the audience feel comfortable and keep the space open and safe.
– Let them get to know me as a professional and as a person.
– Give them context, guidelines and feedback, but allow them to be free to express themselves.
– Make the workshop interactive and exploratory (I don’t want them to believe me just ‘because’ – I want them to test out what I’ve said through practical exercises and kinetic learning).
Now let’s see how these guiding principles have played out in some live workshops I’ve run, and what I’ve learned in return.
Democratising data design for local citizens: Case di Quartiere (Brindisi, Italy)
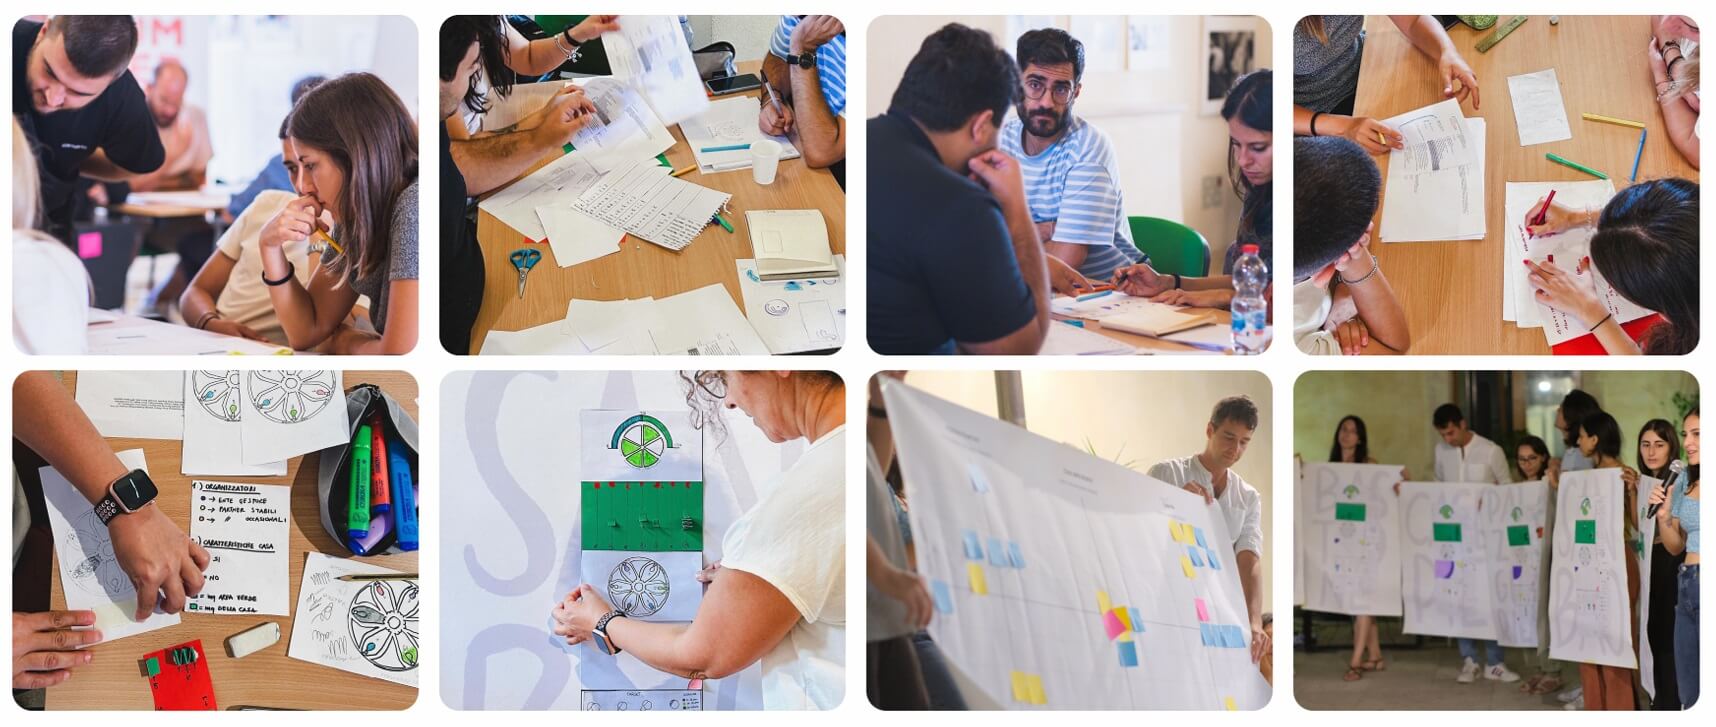
Case di Quartiere was a workshop I hosted in Brindisi as the final step of a city project that aimed to reimagine abandoned or confiscated places with new services and opportunities for that particular city neighbourhood and its citizens.
Over two days, I worked with people working in the local government association and living in the city to visualize social data, starting from a messy dataset and ending with seven creative visualizations showing all the effort and achievements so far. I guided them into this crazy world of data, focusing on creativity and visual metaphors, so that their knowledge of the city and their lived experiences became an important aspect of the creative process.
Learning: The fun factor of this workshop meant it could become a moment of celebration and awareness of the value of their territory and the work they did there. Together, they turned complex data into accessible infographics, opening the data experience to all citizens. The approach made them feel more involved in the workshop, brought clarity to complexity, and gave them a real voice.
Workshops can be relaxed, too: Interactive Things (Zurich, Switzerland)
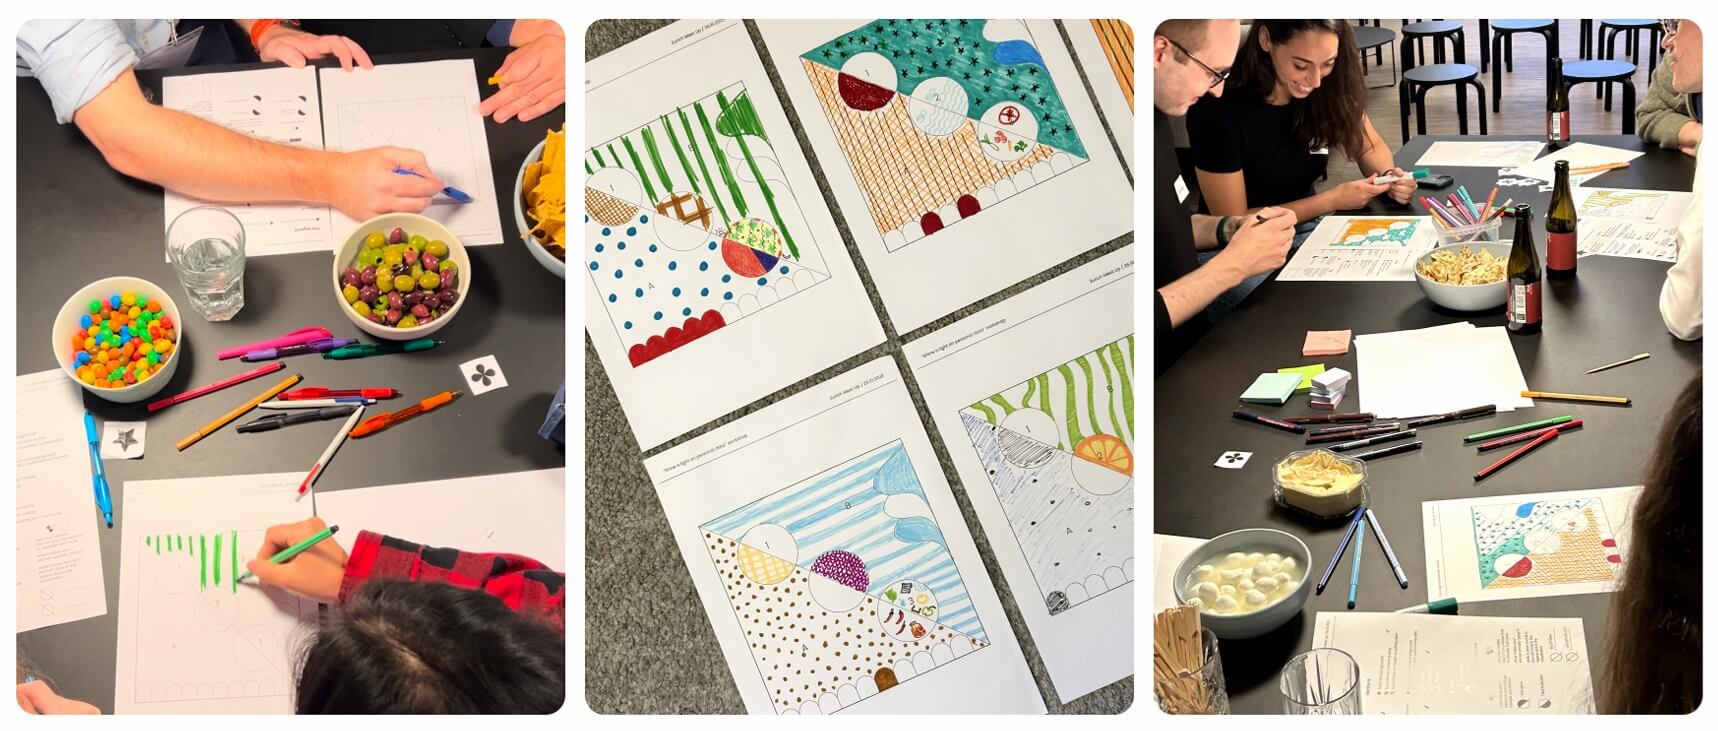
Are you a sweet or savoury snack person? Well, the amazing team at the Interactive Things office provided both of them for this workshop! Data visualisation researcher Alenka Gucek and I went there as founders of the Journal Data Viz Challenge to bring our format and give people a creatively chilled night.
We asked the attendees to work in pairs and to co-create a visualization about their respective design houses – or even better, the sum of their houses. Everything was shared, from the data collection to the finished visualizations.
Learning: By choosing a universal and positively emotive topic, we enhanced the relationships between our guests, fuelling their conversations and knowledge sharing in a fun and freeing way. The snacks helped, too!
Building on common passions: Information+ (Edinburgh, Scotland)
This workshop at the Information+ conference brought together many people from different backgrounds and with different approaches, so we decided to bring the exercise about house-building to the next level.
We divided everyone into groups, and they were given time to get to know each other. They then worked together on the exercise, creating a common dataset from their personal experiences and feelings – building a huge house as the sum of their favourite rooms.
Learning: People’s creativity can really be ignited by the discovery of a shared passion. During this workshop, one group of participants who had never met before found out that they shared a common passion for cats – and that’s how their huge house turned into a visualisation in the shape of a cat’s scratching post!
Keeping data honest: Outlier (Chicago, USA)
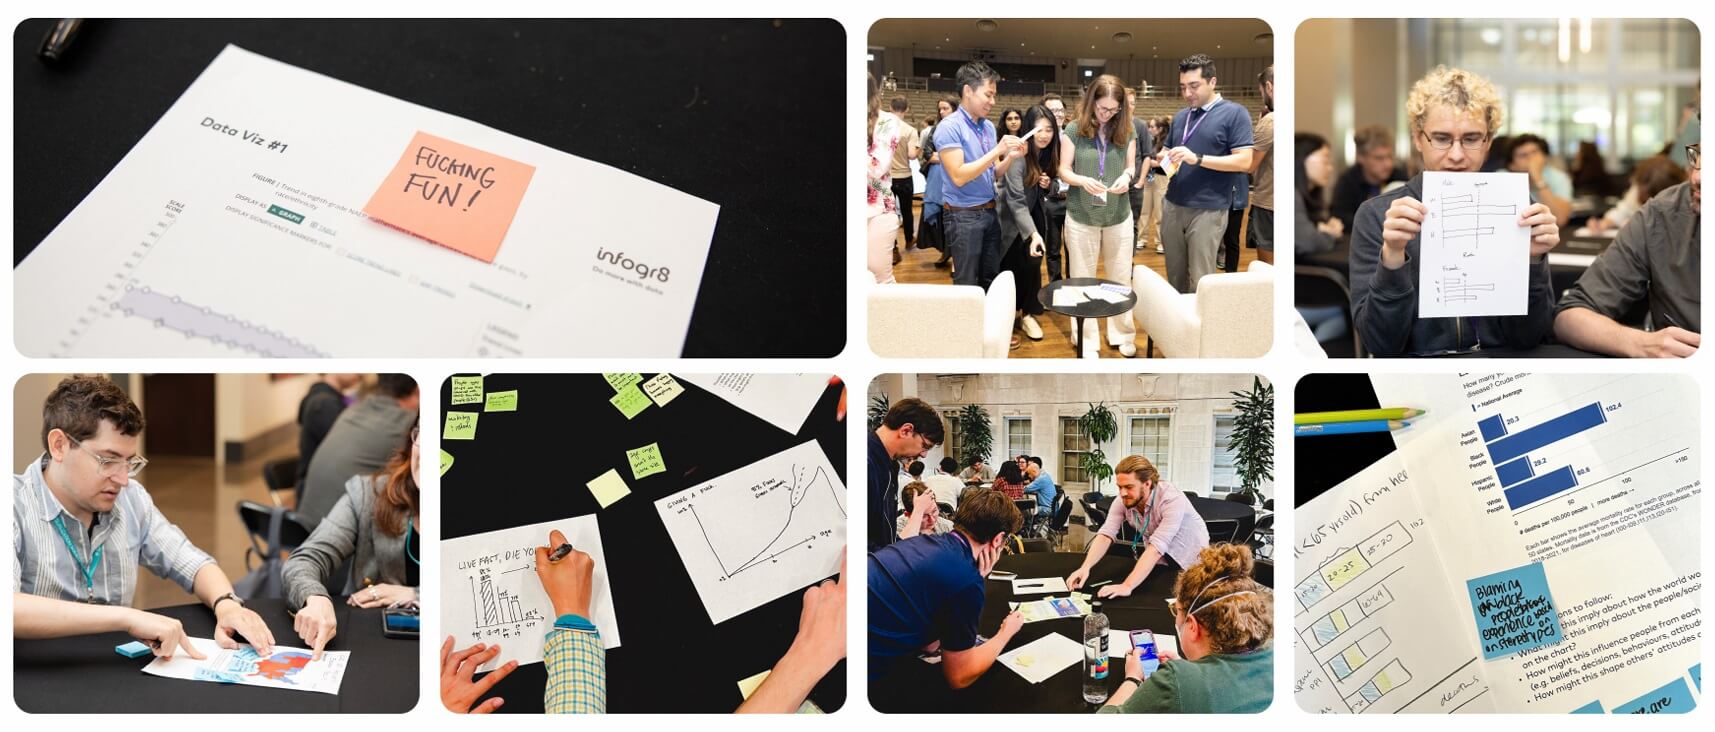
Back at this year’s Outlier in Chicago, Eli Holder and I hosted a workshop focused on misleading charts and how the same data can tell different stories.
By analysing misleading charts, our attendees discussed improvements and solutions to data misinformation. They also had the freedom to go the other way and come up with even weirder stories that they could have told starting from those charts.
Learning: Looking at data visualisation every day can make us too used to it. Keeping things fun and open is a good way to brush up our data literacy and awareness.
Data doesn’t have to be boring. And visualising it doesn’t need to be a boring process, either. By introducing more playful elements like gamification, group activities and knowledge (and passion) sharing, we can spark innovative data experiences and unlock new sources of value.
So, what’s the next data workshop you’re signing up to?
Are you looking to upskill your in-house data talent?
Talk to us about a visual data workshop
Get in touch