ICYMI – Weekly round up of inspiring visual content Vol. 34
Reading time
Category
Missing your data-led visual content fix? Fear not, we got you. From the analysis of the chance to be replaced by robots to an interactive representation of the true size of any country in the world, the team at infogr8 have curated the most inspiring and interesting visual content we have stumbled on this week.
BBC
Interactive module

We saw the movie Chappie earlier this year, a tale set in the near future where crime is patrolled by a mechanised police force. Police officers will be pleased to hear that there jobs are actually relatively safe, and there’s a low likelihood of robots taking over their roles in the next few decades. At least that’s according to the BBC who have just produced a interactive module which allows us to input our occupation and see how at risk our jobs are. Unfortunately, it’s bad news for telephone sales people, who face a 99% risk of being replaced in the next few years. We are asked to enter our profession, and we’re then presented with charts visualising employment rates over time, and likelihood that machines will replacing us in the future. Lucky are roles here at infogr8 do not require us to squeeze into small spaces, assemble objects, or manipulate small objects, so it seams our jobs too are safe for the moment.
How the World Moves
Jawbone
Interactive module + Interactive map

Our friends at Jawbone have released some new exciting sleep features and a new heart rate monitor the past week. To give a more complete look on the heart health, they have added a passive heart rate monitor that updates almost real-time. As data is captured over time, Smart coach is able to identify patters and habits in your lifestyle and give more tailored advice.
What captivated us this week is this fascinating interactive module that shows how the world moves over a period of time. It’s simple, yet effective, showcasing Jawbone’s wealth of data from its users. You can pick a country or city and see how it moves from sunrise till dawn. It gets even better, on a separate interactive map, you can delve into each city and see on which parts of it people move the most. It’s no surprise that parks in London are most popular areas, reaching a whopping 3000+ steps per hour. That’s 1.5+ miles walked or run each hour or approx. 3 hours to go around Hyde Park. 🙂
It’s refreshing to see wearable companies like Jawbone making use of users’ data to produce relevant content that resonates with their audience and enhances the overall user experience of their product.
The Complete History of the NFL
FiveThirtyEight
Data Blog

London sports fans will soon welcome six American Football teams teams when the NFL International Series Kicks off at Wembley next month. Teams playing include the Miami Dolphins, the New York Jets Tickets and Buffalo Bills, but do you know which are actually worth routing for? FiveThirtyEight have all the answers in The Complete History of the NFL, a data blog post which visualises the highs and lows of every team to ever play in the league. Using the Elo rating system, a method developed by the physicist Arpad Elo that was originally used to rate chess players, we are shown how all the teams performed against their competitors over time. From the Dallas Cowboys remarkable return to form in the early 1990s, to the sad deterioration of the Miami Dolphins in recent years, there are plenty of data stories waiting to be uncovered here.
James Talmage and Damon Maneice
Data driven website
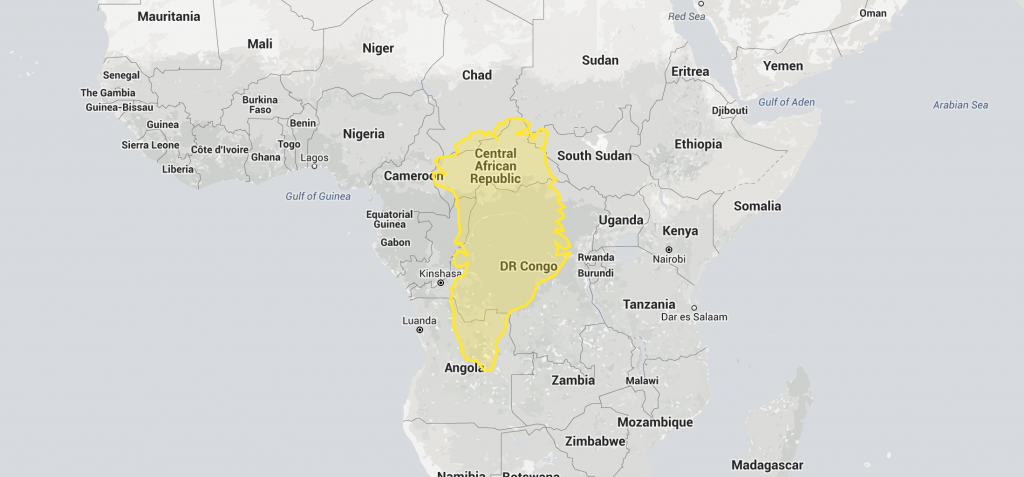
It all started with The True Size of Africa map, and since then there have been much discussion over the relative size of various countries against other land masses. Misconceptions are due to the Mercator Projection, a method of visualising the Earth’s spherical service onto a flat plane. This greatly distorts and exaggerates the size of countries away from the Equator, leaving us with an inaccurate impression when we view maps in textbooks. Well, with the magic of technology we can hopefully put all discussions to rest. A data driven website from James Talmage and Damon Maneice allows us to pick up any country and place it next to another, while automatically scaling the size to allow for accurate comparisons. Greenland is often portrayed as a humungous land mass close to the North Poll, but move it closer to the equator and you’ll see that it’s just taking the pie.
Highfive
Scrollable story

It’s a common fact that co-workers can be spread around the globe, and this makes communications harder and often annoying if there isn’t the right technology to support them. The guys at Highfive have developed an interesting tool to make work communications much easier. They tried to answer questions such as ‘How do you handle communications with colleagues in another room? And what if they are in another city? And in another continent?’ off the back of it they came up with Highfive communications technology.
To promote the product Highfive, in collaboration with Column Five, decided to differentiate themselves from the competition developing a humorous, engaging story that lays between a video and a scrollable story with the advantage being the user can move on at their own pace. The features of the product are conveyed clearly and cleverly which makes this a well bodied piece of content.
Death in Syria counted
New York Times
Data story

The Psychology of Colours in Marketing
Kate Rinsema
Infographic

Colours have always influenced human behaviour. Some are relaxing, some stimulate appetite and others recall memories or encourage shopping. Many professionals specialised in different fields of expertise have investigated these effects on our brains and their findings are quite stunning. Clever marketers know the basics pretty well and are designing their campaigns with colourful influence. But be careful! Reactions to colours can vary from culture to culture and what is extremely successful in a certain country can lead to disaster in another!
The infographic created by Homestead and brought to us by Kate Rinsema shows a sum up of the results from various studies on how to properly use the right colours for better catch your audience, alongside some examples from well known companies.
Max Planck Research magazine
Infographic

Humans are unique creatures in many different ways, but this week we learned something else that sets us apart from many other living things. Apparently, we age differently. We may take it for granted that it becomes more and more likely to die the older we get, but this is not the case for many animals and plants, such as the desert tortoise or netleaf oak tree, who both become increasingly less likely to die with age. Moritz Stefaner has produced a beautiful infographic with the help of Jane Pong and Sarene Chan, creating a spread for Max Planck Research which visualises mortality and fertility across a range of species, with some showing rising, consistent, or declining mortality rates across their lifetime. The inclusion of simple illustrations does not distract our attention from the charts themselves, and they actually help us understand what is being shown more easily. We think this piece is the perfect example of form balanced by function.
We’ll be sharing more inspiration next Friday, for now you can follow the team on Twitter @infogr8. Please tweet & share your viz spotting stories to be considered for our future rounds ups. #vizspotting #ddj.
We’re hiring! Several new awesome roles within the infogr8 family including account management, digital PR manager & web development.