How AI supported me in creating better data storytelling
Reading time
Category
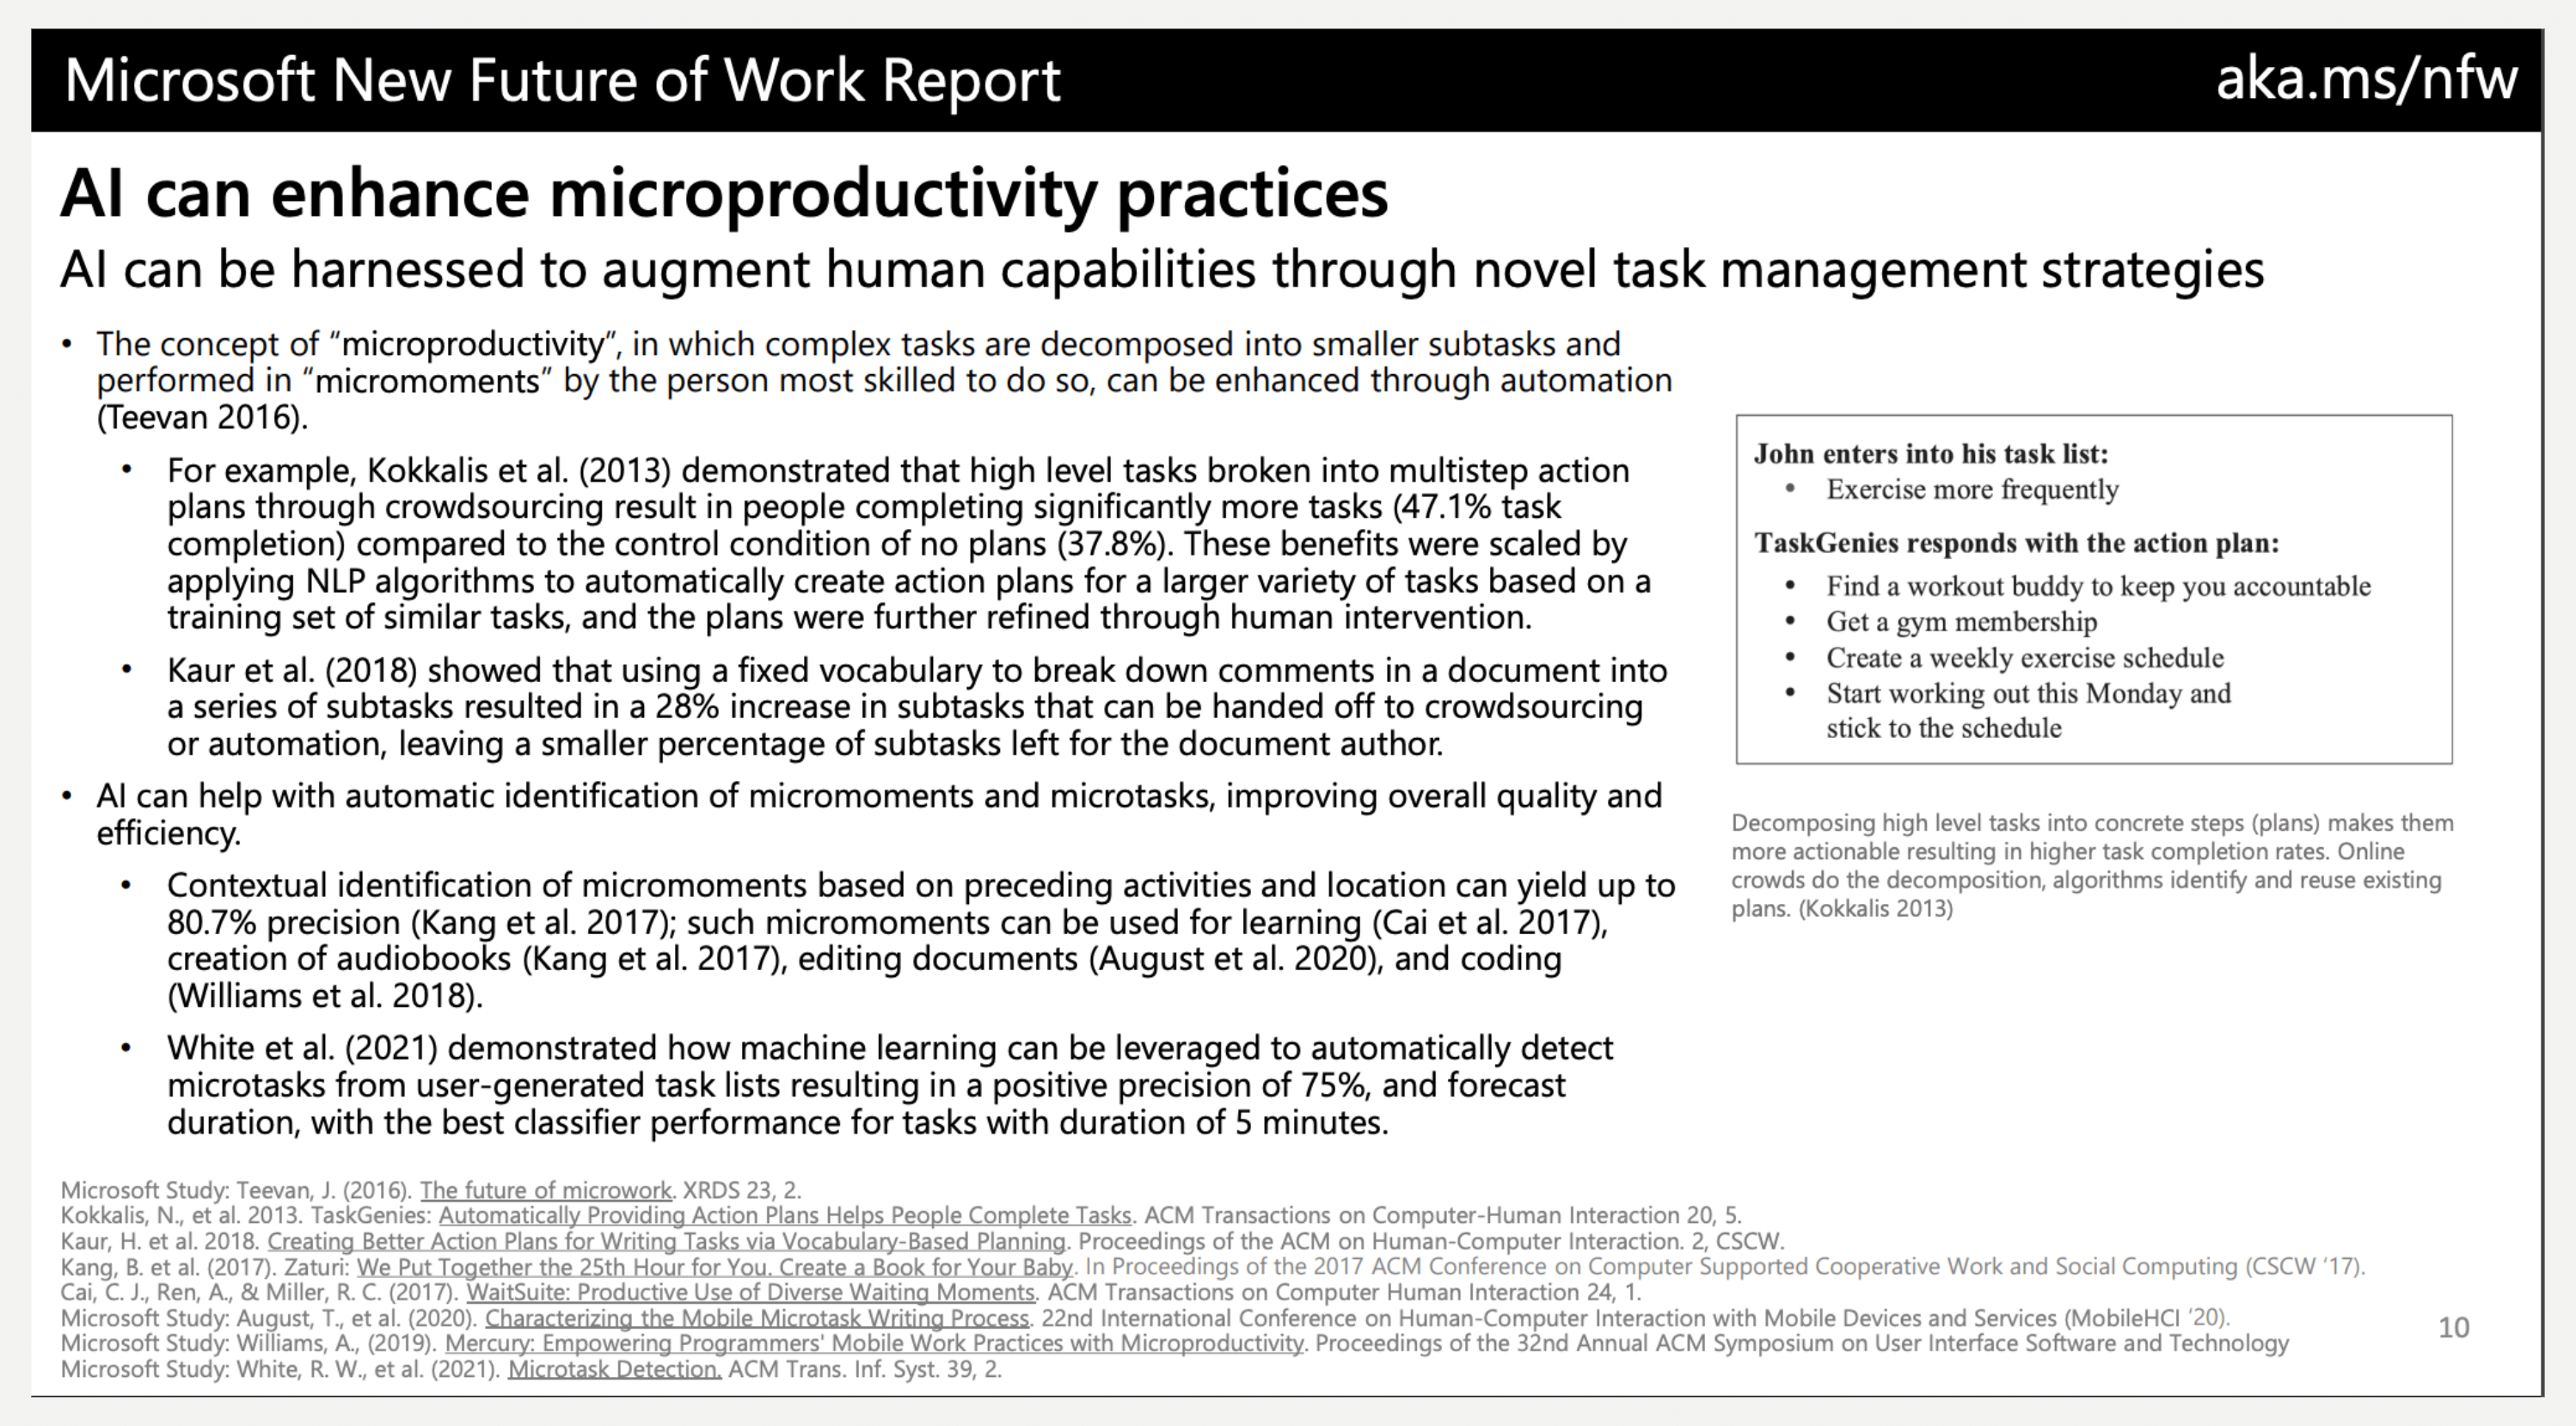
Microsoft recently published its New Future of Work report, with a strong emphasis on the way that AI is set to change how workers go about their daily tasks. For such a future-focused piece of research intelligence, however, the final report is very academic-looking and difficult to parse. So I wanted to use AI to tell the story differently, and to make its insights more immediate, whoever the audience.
Here’s the original report published by Microsoft:
In the field of data design and storytelling, the fusion of creativity and technology opens up new avenues for crafting compelling narratives. Since I was re-designing an article about AI enhancing workflows and productivity, I took the opportunity to reflect on how AI can itself be a useful tool for information designers and storytellers to support their workflows.
The design process often begins with the challenge of transforming raw information into a well-structured narrative. For any designer, the clarity of concepts and information is essential. As I delved into the poorly designed original presentation, I looked for a solid foundation, which is crucial before the aesthetic journey begins.
The role of text in data design
I can’t design if the concept and the information are not well-structured beforehand. The journey from text to visualization is essential, making me always look for information hierarchy. It starts with the core question: What is the main story? In the case of Microsoft’s research presentation, the central narrative emerged as “AI enhances microtasks.”
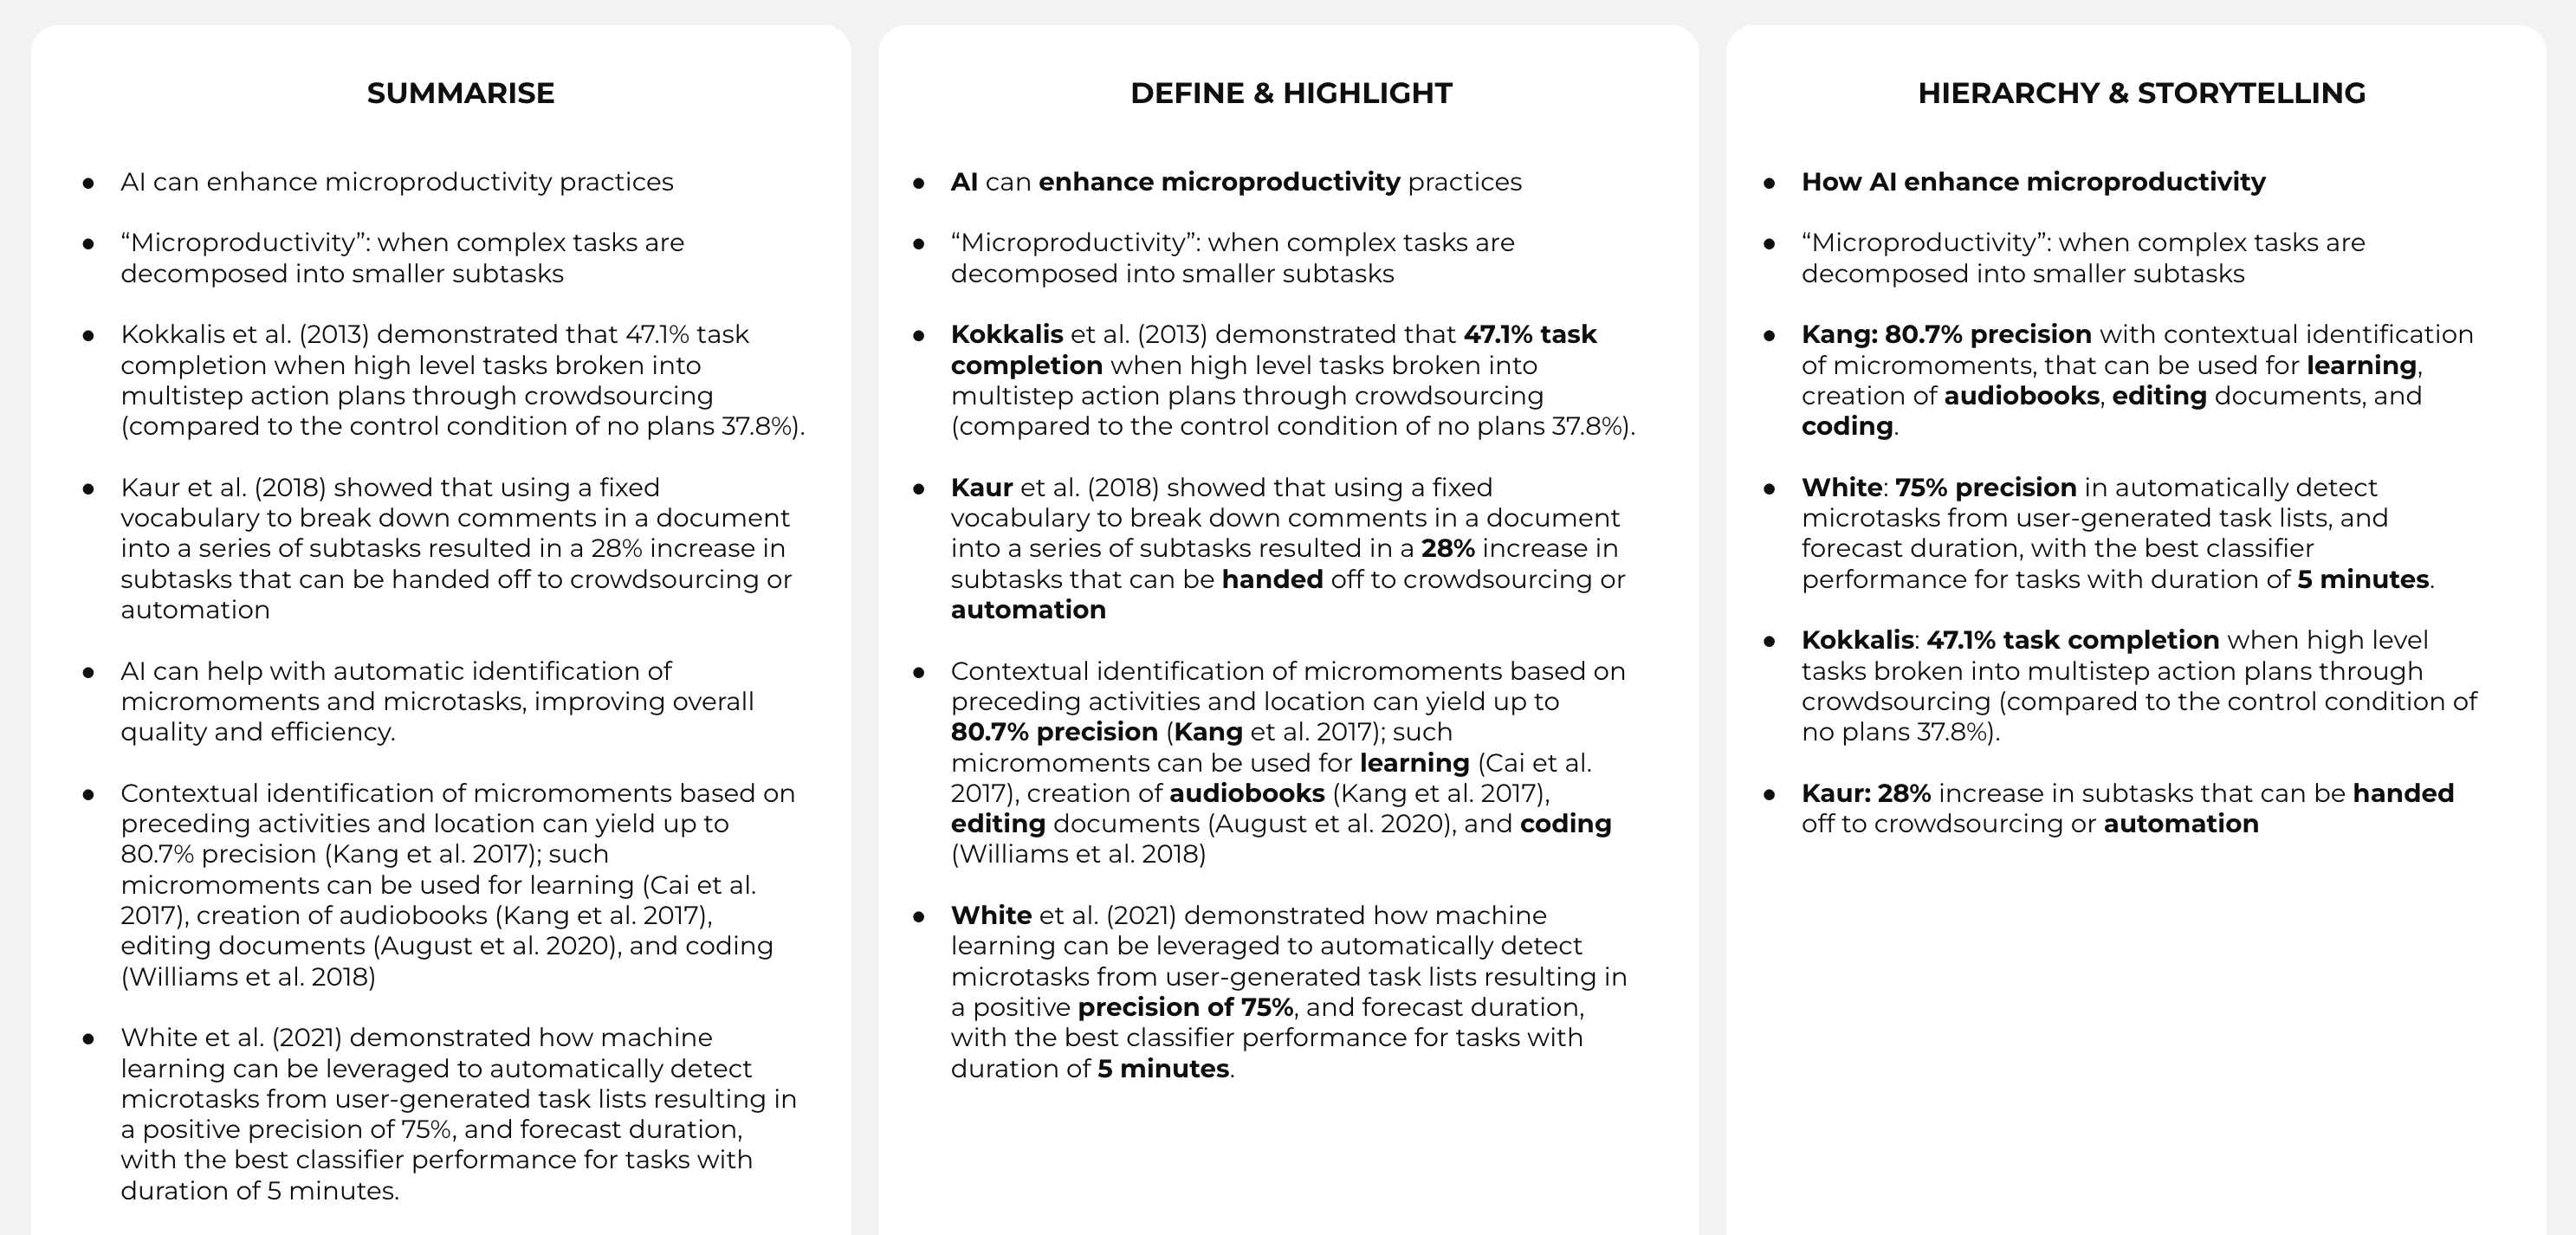
With the main story identified, the next step involves extracting the essential details that support and enrich the narrative. This is where data storytelling starts, selecting key information and creating an information hierarchy. Unnecessary words are discarded, leaving behind a streamlined and impactful narrative. I asked ChatGPT to support me along this summarising and clustering journey, while making the information easier to digest and to work with.
Bringing data narratives to life
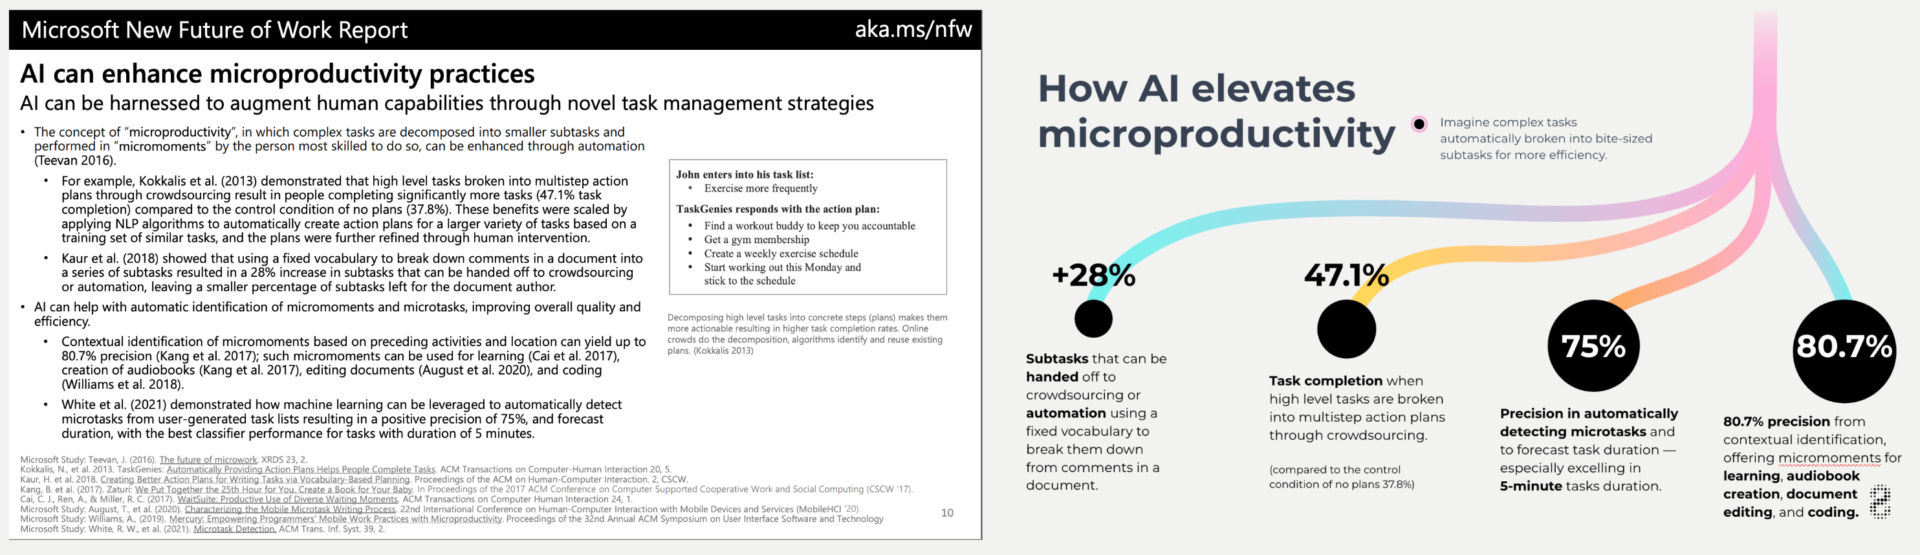
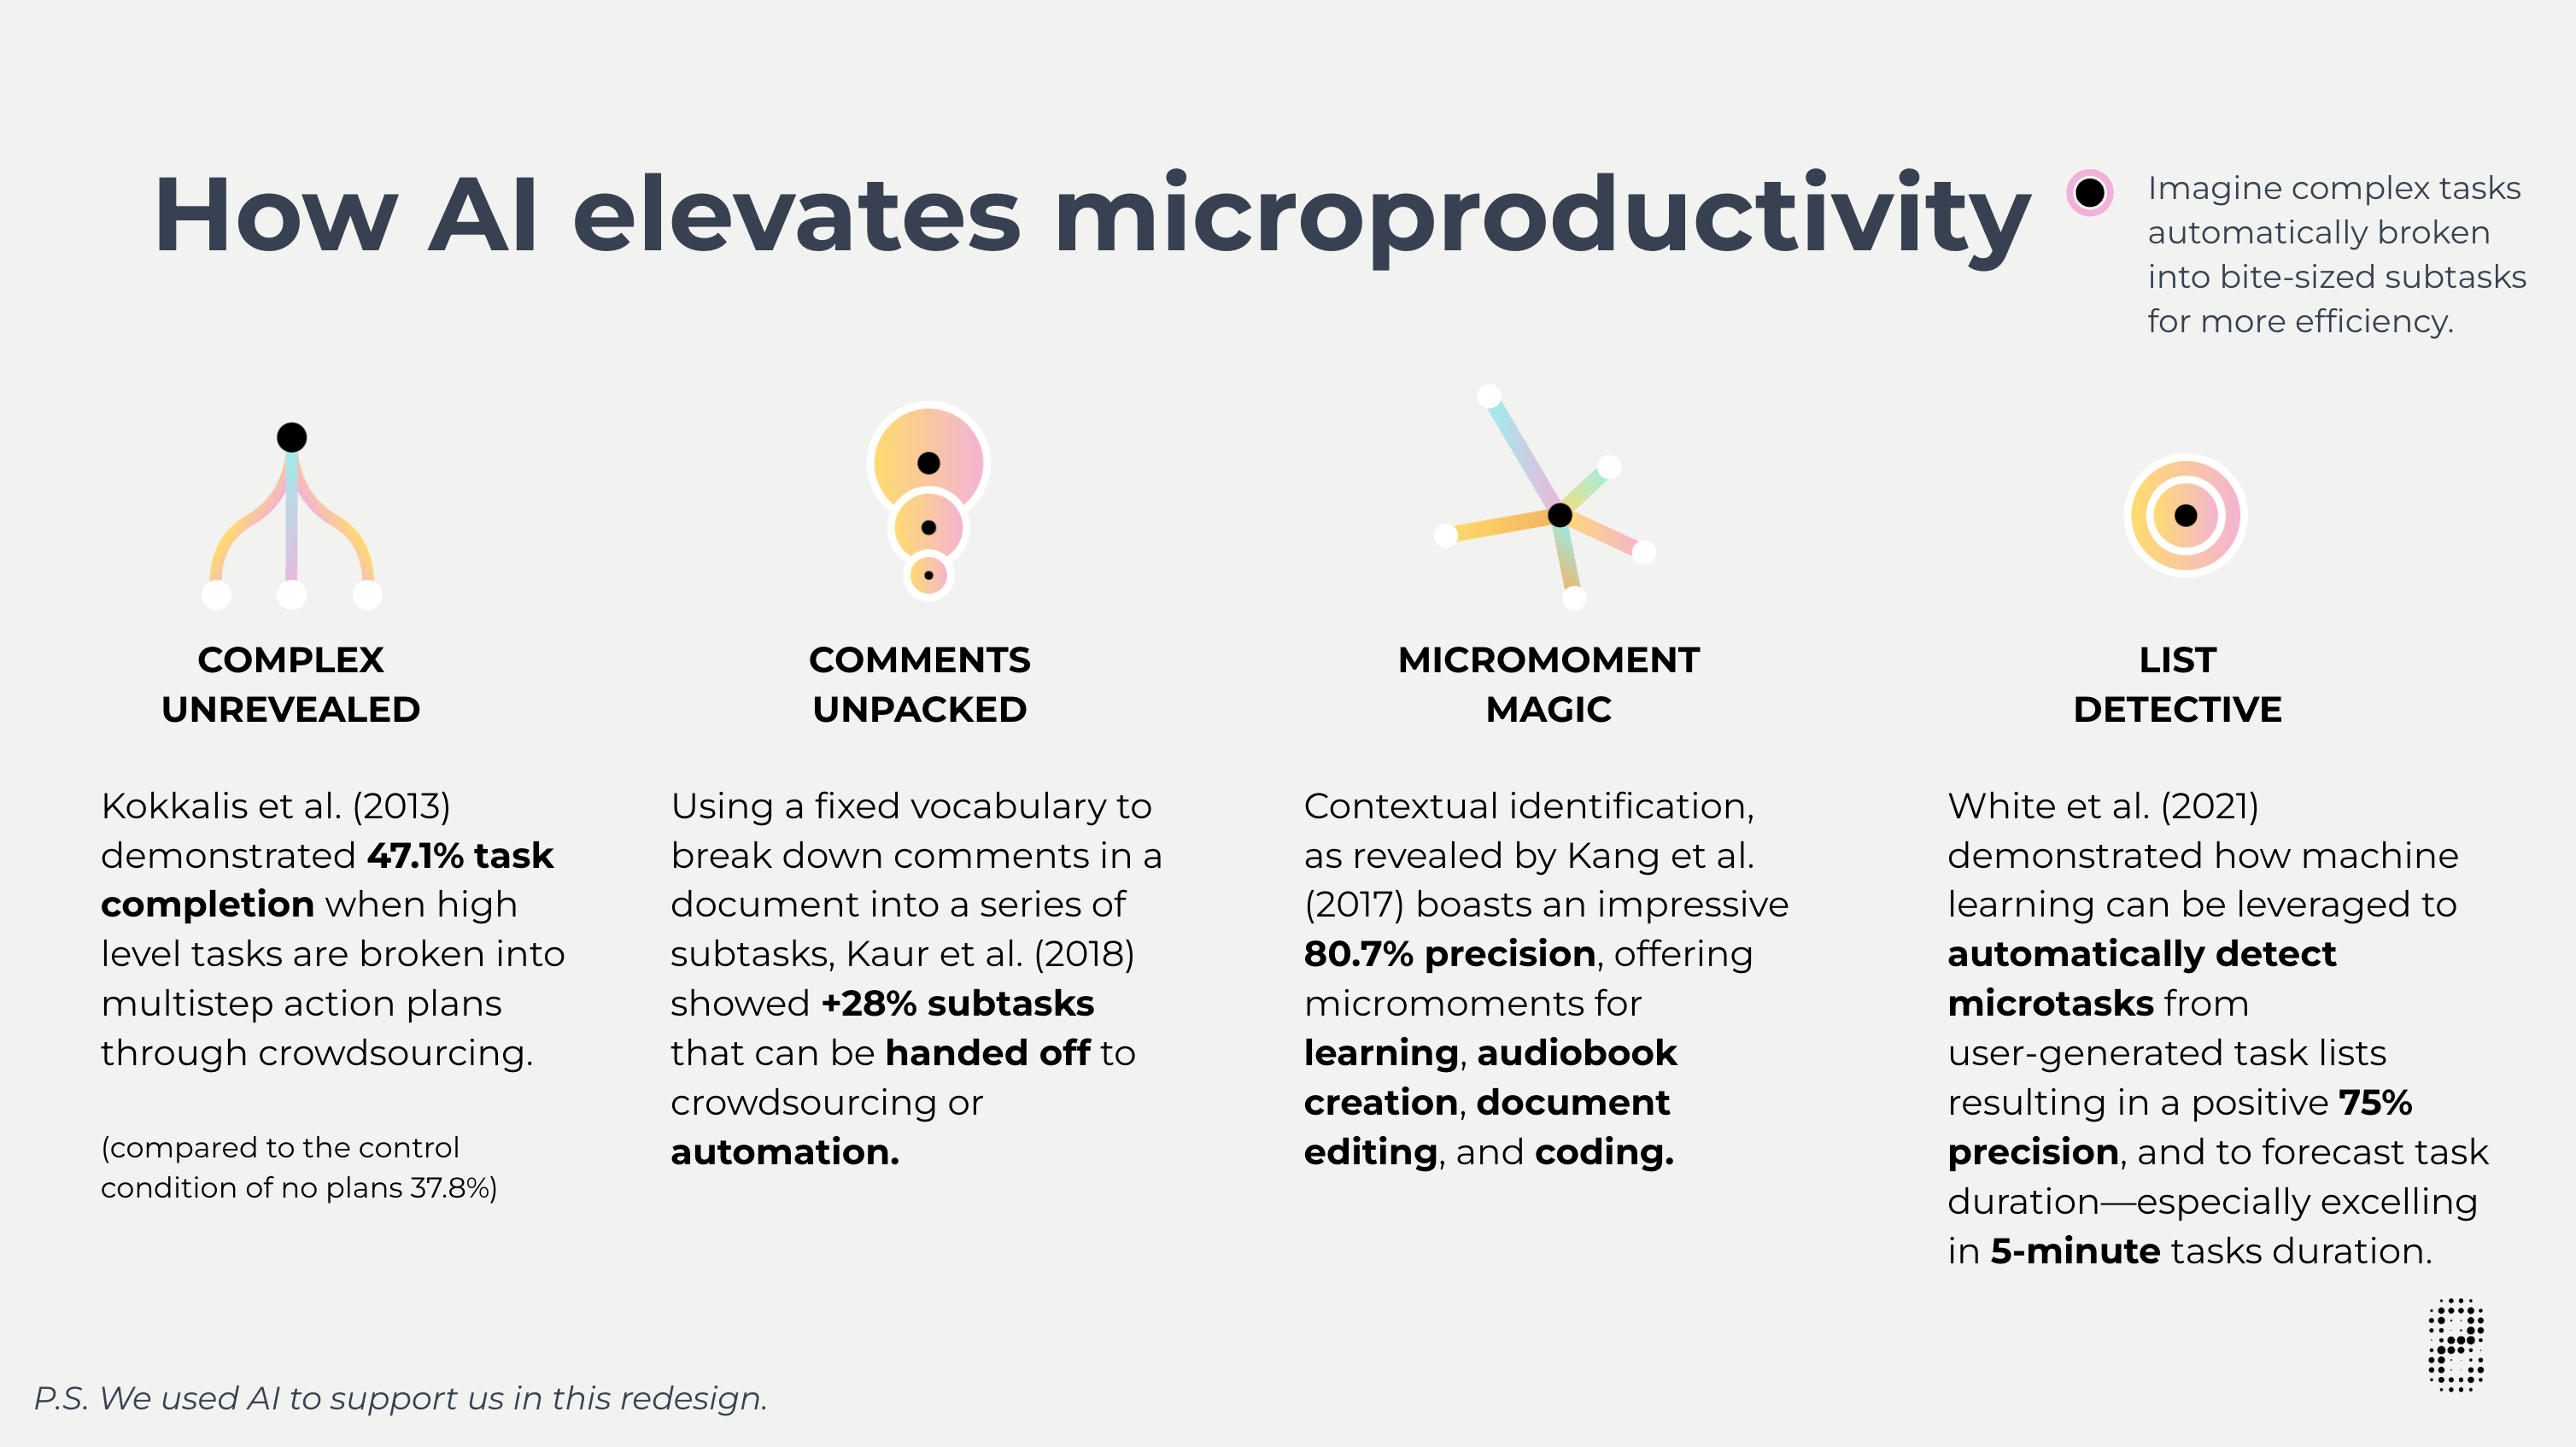
Once the information and storytelling were set and clear, I could focus on making them visual. In the presented case study, the narrative revolves around four tested theories showcasing how AI supports productivity by creating microtasks.
The theories shown are complementary to each other, making me picture the “part of a whole” concept. I wanted people to see that AI is a container that can lead us to different options and improvements, as demonstrated by the theories. This is where data comes in. I wanted the reader to focus on facts, numbers, and percentages – I needed them to trust the story.
The information hierarchy is essential for layering the data. It’s important to choose what’s the first information I need people to look at (the title), and the next one they may want to read (the description of “microtask” and the data paragraphs to deep-dive into the topic). Visualising solid storytelling and information architecture makes the reader not feel scared of the content, especially when it is complex and includes numbers.
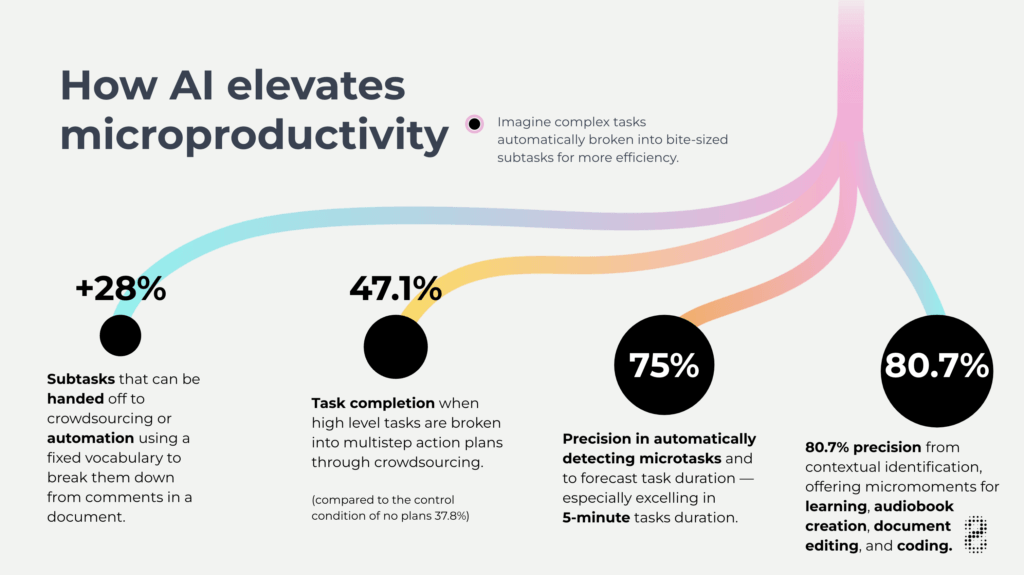
As AI creates microtasks from larger ones, the data visualization focuses on showcasing the results rather than the approaches. Bubbles, representing percentages, create a visually captivating journey for the audience, letting them have an immediate overall idea of amounts and comparisons. The use of branches, leading to the bubbles, offers a unique and engaging way for the audience to guide the reader through the data and absorb the information.
Adapt visual insights to the story
What if the information hierarchy slightly changes? Do the readers want to focus on the results, or are they more interested in the research? The point of view of our story moves a little bit, focusing more on the four micro-stories about the researchers, their theses, and then the insights.
If the storytelling and the layer of information change, the visuals also need to adapt. The essence of the story is encapsulated in short, engaging titles, each accompanied by a visually striking icon. This visually creates four blocks, communicating different stories and insights from each. The icons add an element of curiosity and inspire the general meaning of the paragraph.
Storytelling is indeed the bedrock of effective communication, whether through written or visual means. The intersection of storytelling and AI not only enhances the efficiency of conveying complex ideas but also opens doors to creativity in design.