Martina Zunica
June 21, 2024
As an information designer, I count things. That’s what I do. So I think that’s the best way to start telling you about my experience at Outlier 2024.
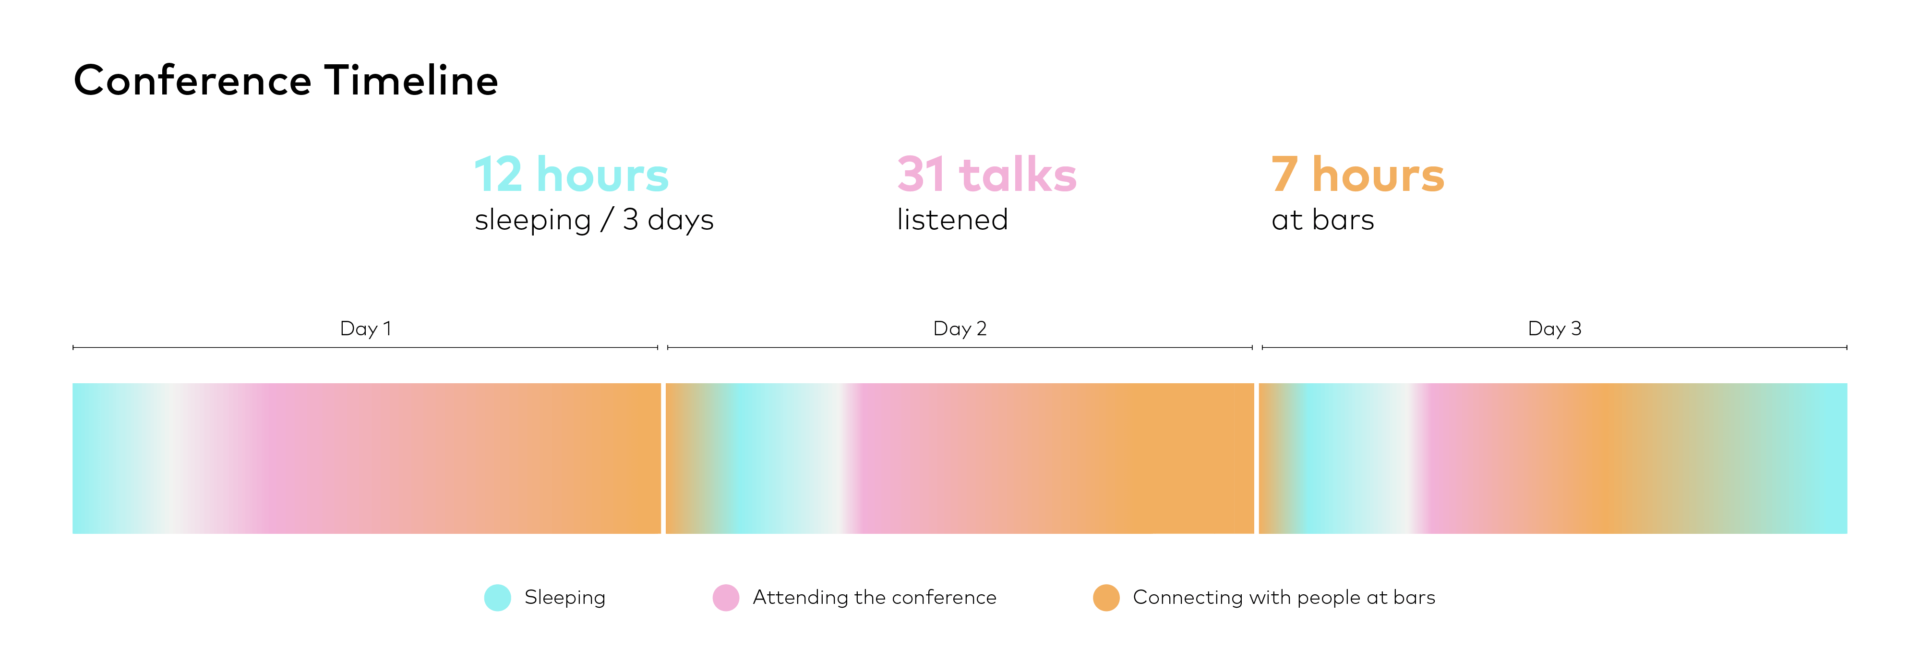
How I spent my time at Outlier 2024
These numbers might seem trivial at first glance, but they encapsulate the essence of the conference: a vibrant, engaging, and deeply fulfilling blend of professional growth and personal connections.
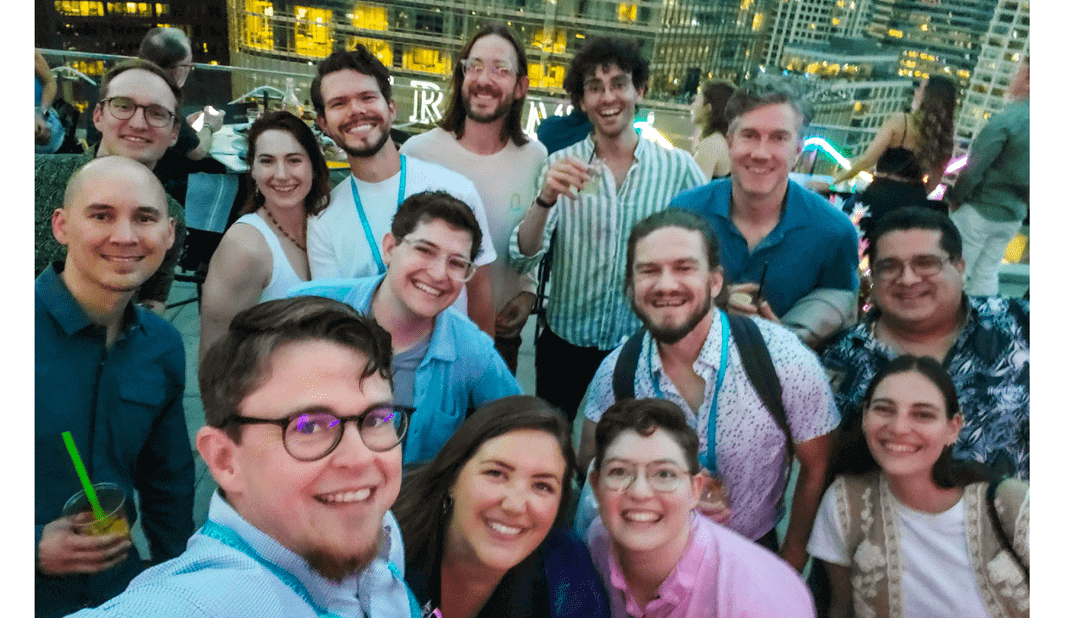
I’ll never be tired of the dataviz community, and one of the standout aspects of the Outlier conference was the opportunity to reconnect with old friends.
We picked up right where we left off, sharing stories, exchanging ideas, and simply enjoying each other’s company. Meeting 20 new people from around the globe was equally exhilarating, expanding my network and introducing me to fresh perspectives and innovative ideas.
One of my favourite aspects of this community is the variety of backgrounds we all come from: from science, design, research, and psychology. But the only real difference is if you’re a hug-person or a handshake-person: I am the first one, collecting more than 7 hugs from old and new friends.
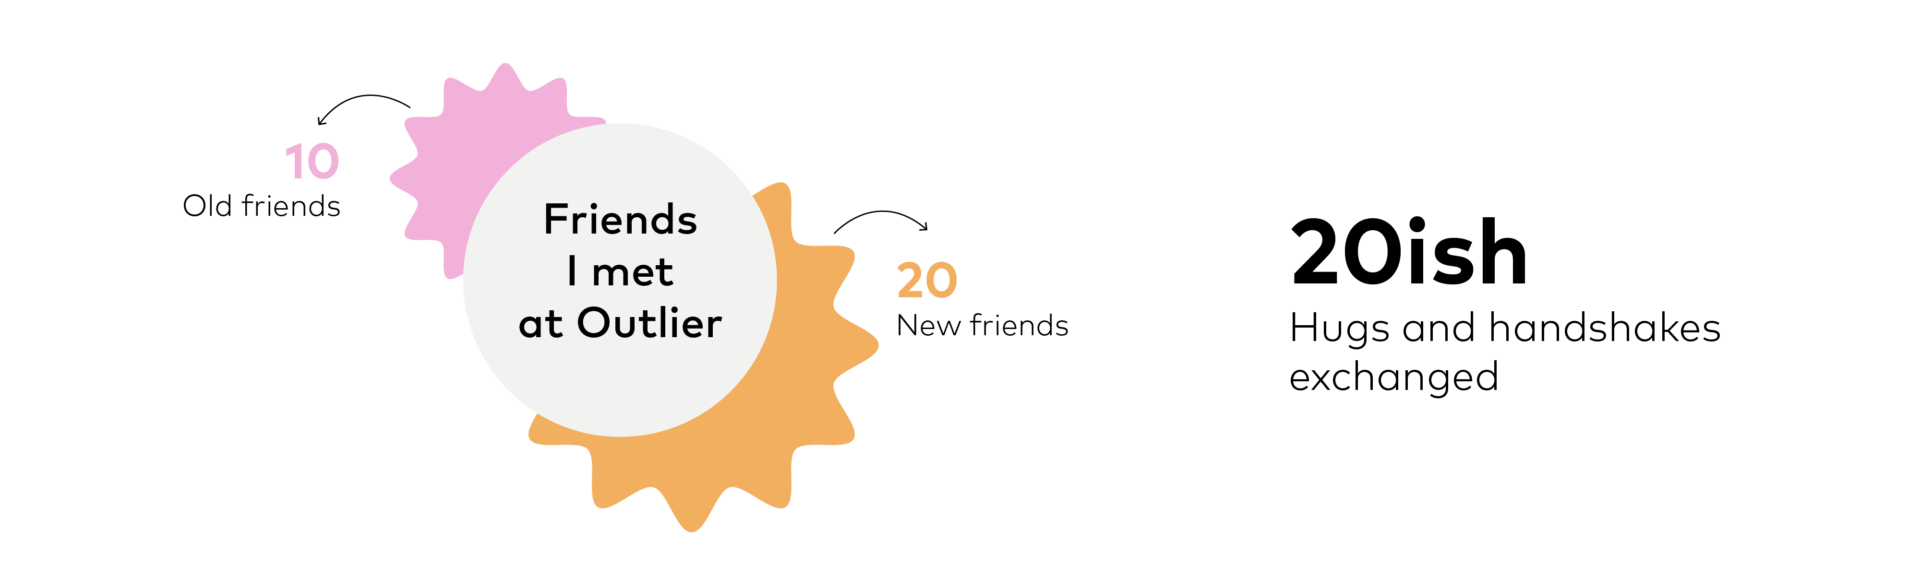
Meeting old and new friends at Outlier
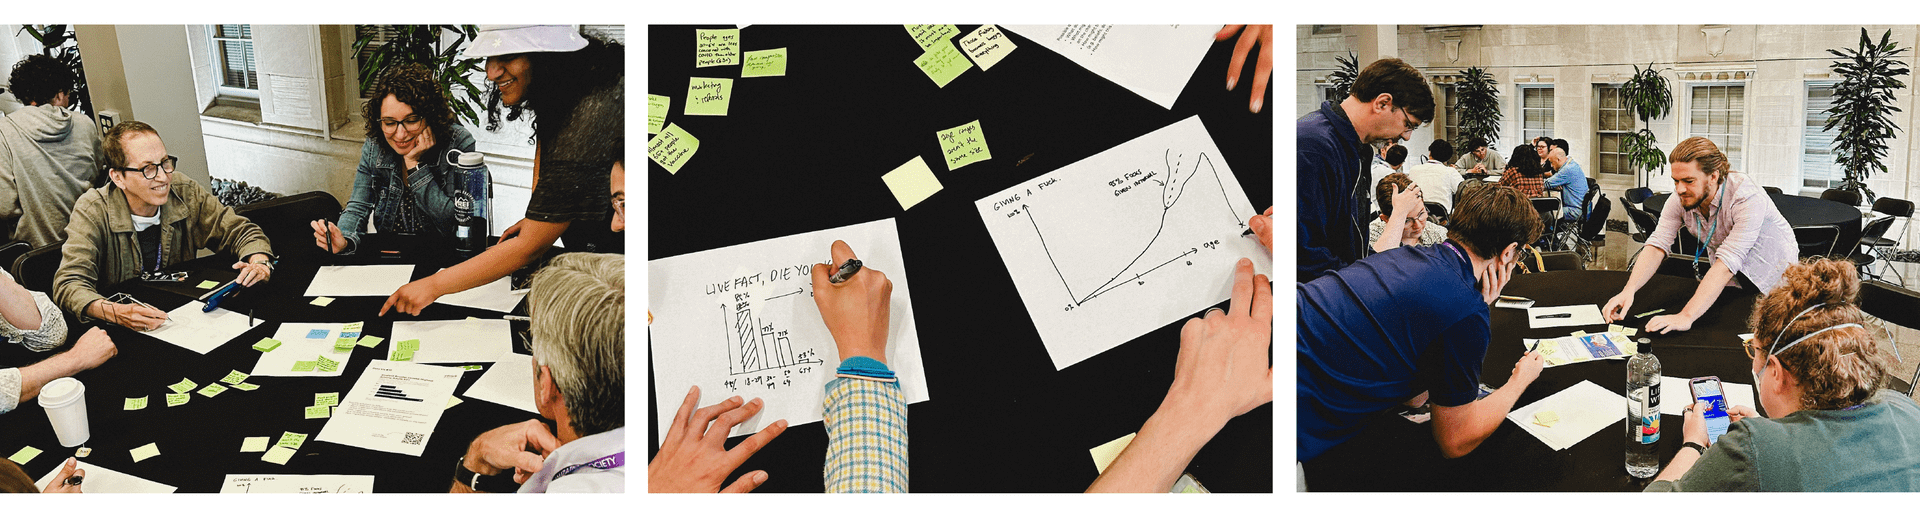
One of the highlights of my time at Outlier was hosting a workshop from our Future Fridays series at infogr8, in partnership with Data Visualization Society. The session focused on a critical yet often overlooked aspect of our work: the potential for charts to mislead and the ethical implications of data storytelling.
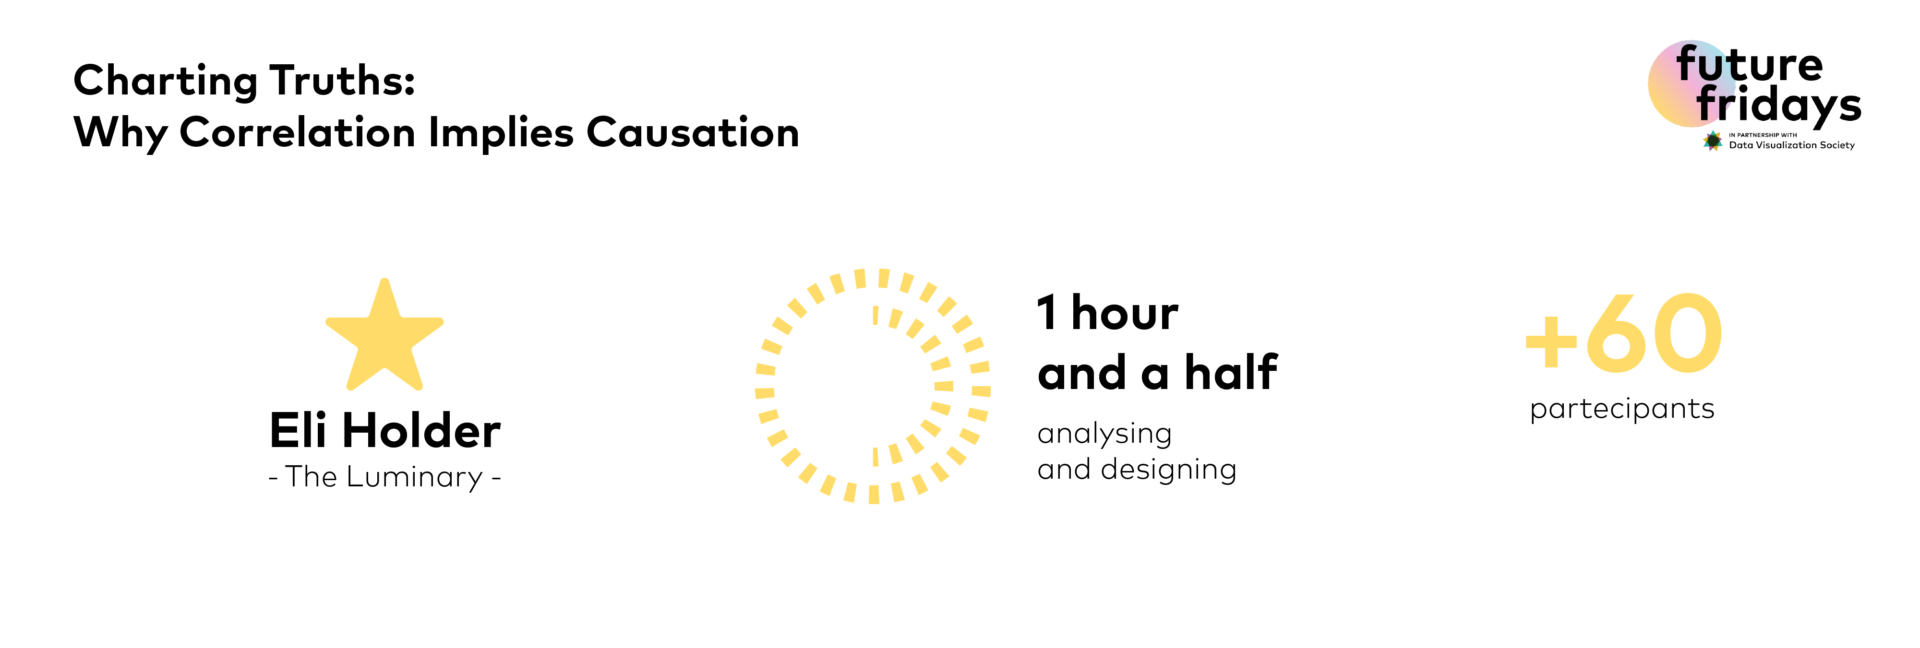
Tackling misinformation in data with Eli Holder
Supported by our amazing luminary Eli Holder, attendees delved into real-world examples of misleading data visualisations and how stories can enhance visualisations, carefully asking ourselves (to quote Eli) “what we see and what we actually see.”
We analysed these charts, discussing how they could be interpreted in various ways and how they often fail to tell the whole story, especially when stereotypes and half-true stories are represented.
“Stereotypes hurt everyone” – Eli Holder
That’s another quote from Eli. As a result, we brainstormed alternative narratives and debated the choice between highlighting the true story behind the data or emphasising the gaps in the previous charts. This exercise prompted a rich dialogue about the responsibilities we bear as data visualisers and kept our focus on the importance of keeping our minds open and creative:
“Giraffes can be blue, kids will still recognise them as giraffes” – Valentina D’Efilippo
The Future Fridays workshop was inspired by the commitment of our luminary to the ethical considerations in our field – and the core values at infogr8.
Our commitment to ethical data storytelling is more important than ever in an era where data can be easily manipulated and misrepresented. The workshop reinforced our mission to promote clarity and truth in data visualisation, and the knowledge and inspiration gained at Outlier will undoubtedly inform our future projects.
The enthusiasm and engagement in the room were palpable, and the participants walked away with a deeper understanding of the impact of their work and the importance of integrity in data storytelling (and with a great desire to celebrate and dine… it was only 7pm, after all!)
Outlier wasn’t just about professional development. It was also a personal reminder of why I do data visualisation and the value we add to it as professionals and human beings.
It’s pretty common, among designers and especially women, to experience impostor syndrome – as if what we do is never enough, or it’s always late. In the context of a global conference, I appreciated the inclusivity shown across the entire event, from the pronouns stickers on our badges, to the speaker representation and talks presented.
“Repetita iuvant”, says the Latin. “Repeating does good”. At the end of Outlier, the words that most resonated with me are:
“Impostor syndrome doesn’t exist. How could it exist when the entire life they told you you’re not enough?” (from Leticia Pozza and Pey Ying Loh’s talk on running feminist data studios)
Repetita iuvant.
This conference was a powerful reminder of the vibrant community we are a part of and the important role we play in it, professionally and personally.
Altogether, my time at Outlier was a whirlwind of data, inspiration, and connection, and I’m grateful for the experience. If you’re passionate about data visualisation and haven’t attended Outlier, I highly recommend it. It’s more than a conference; it’s a celebration of our field and a powerful reminder of why we do what we do.
Soho Works White City,
Television Centre,
101 Wood Lane,
London,
W12 7RJ