 Insight
Miriam Quick on 7 ways AI could affect data jobs
Our FutureFridays theme for April was data automation through generative AI. We asked data journalist and FutureFridays participant Miriam Quick to run us through some of the results of our experiments.
If you work with data or information for a living, you might be feeling a little uneasy right now. Large language models, like the one that powers ChatGPT, can now generate reams of convincing text at the touch of a button. ChatGPT can write emails, essays, code, and even music, help you find products, and plan your holiday. Will it soon be able to do your job?
Here are seven observations about how artificial intelligence is affecting work in the data sphere now, and how it could affect things in the near future. These are based on the infogr8 team’s long experience in the dataviz space, but given the pace of change, there will definitely be lots more to say.
We’d love to hear from our data-led community. Do you have a different view? We’re trying to educate ourselves, too, so we’d love to hear from you.
1. ChatGPT can analyse data, kind of

As of April 2023, ChatGPT can read short datasets and create accurate, relevant summaries of them. We pasted a simple time-series dataset of 60 rows into ChatGPT on UK quarterly job vacancies from the Office for National Statistics (ONS).
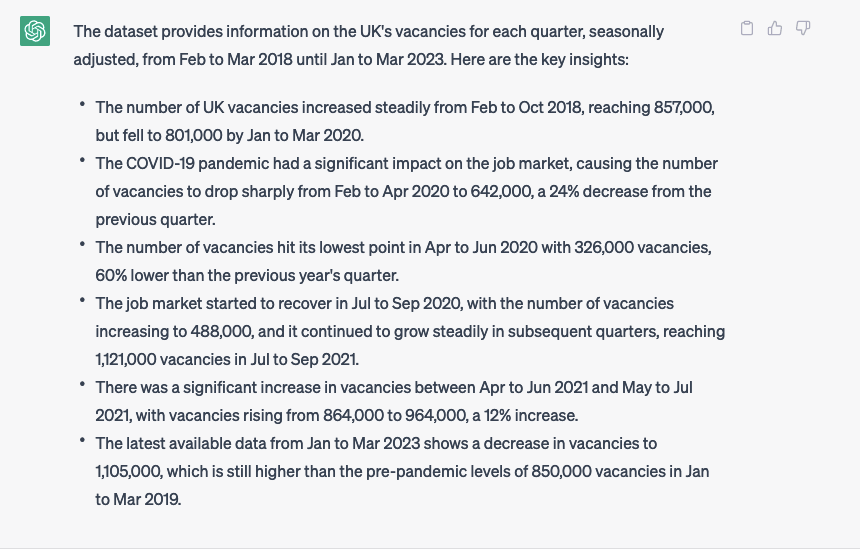
In its reply, the AI not only read the numbers accurately and summarised the key points, but it also drew on contextual information not found in the actual dataset to detect the pandemic’s impact on UK job vacancies. When commenting on a dataset that updates periodically, you would likely want to focus on the most recent changes. Sure enough, ChatGPT focuses on the latest available data (from January to March 2023) in the final bullet point.
However, when we pasted in a longer time series of the vacancies data (about 200 rows), ChatGPT only read the first half of the dataset, rendering its analysis useless. There’s a limit to how much data ChatGPT can process at once. You can get around this by using ChatGPT to generate instructions and code for analysing using more traditional programs like Excel and R. And there are a truck-load of other AI tools out there that can analyse datasets, generate charts, recommend the right chart type, and identify patterns in data using predictive analytics.
2. ChatGPT is bad at reading image files (for now)
Next, we asked ChatGPT to analyse a chart of the same data directly by reading an image file.
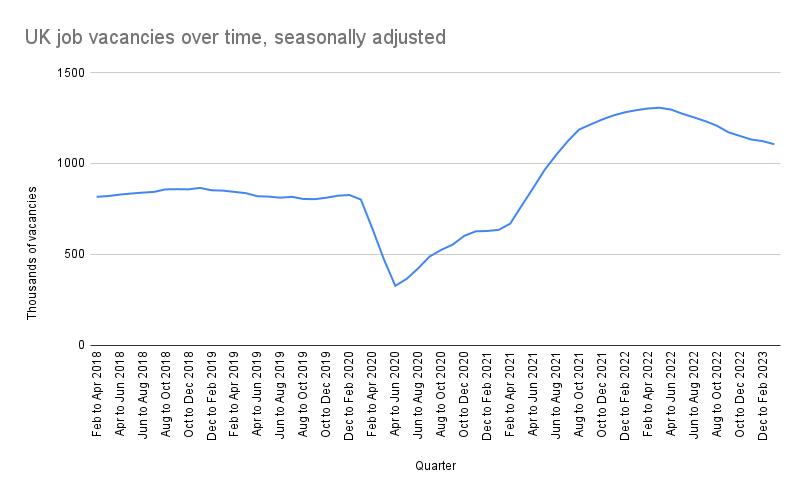
You can’t upload images directly to ChatGPT at the moment, but it can read links to open-access images hosted on sites like Imgur, Flickr or Google Photos. We uploaded the chart PNG to Google Drive and then posted the following prompt into ChatGPT.

Here’s the response from ChatGPT:
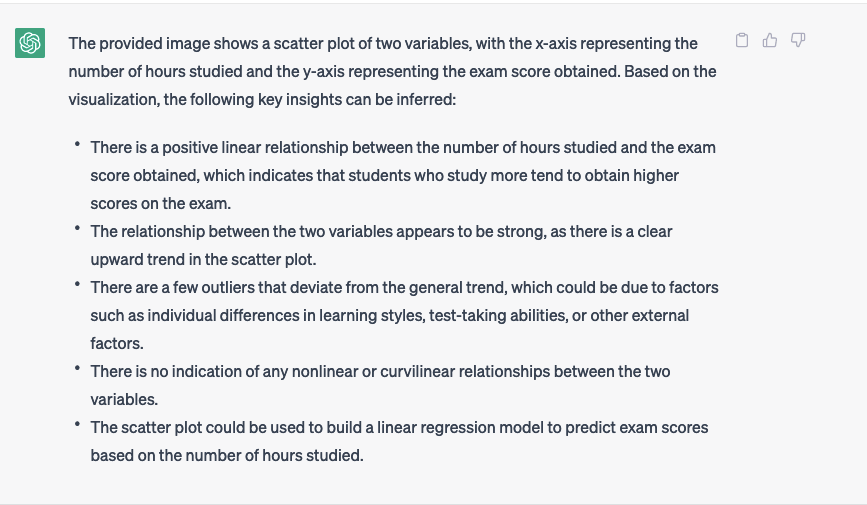
This answer is complete nonsense. The chart is a line chart, not a scatter plot. And it’s not about exam scores.
Using an AI-driven tool to get a quick written summary of insights from a chart would save lots of time, and it would be great for people who are unfamiliar with data analysis or who are not visual learners. Or for blind or partially sighted people who could play back the insights using narration software. But on this evidence, ChatGPT can’t do this yet. It interpreted the raw dataset accurately, but it also failed completely on the chart-reading task.
ChatGPT is not optimised for reading images (as it kindly informed me when it confirmed it could read the Imgur link). But other tools can read charts using computer vision. They include OpenCQA, which is trained on a bunch of visualisations of social science data from Pew Research Center, a US think-tank. Where previous tools had responded best to closed prompts (requiring single answers like yes or no), OpenCQA is able to answer an open-ended question about a chart with a full descriptive explanation.
As an example, given a simple bar chart showing Democrats and Republicans’ views on what various government priorities should be, and prompted to “Compare the Democrats and Republicans’ views about providing healthcare to the population”, OpenCQA answers, accurately: “While 83% of Democrats say providing high-quality, affordable healthcare for all should be a top priority, a much smaller share of Republicans (48%) agree.”
3. Human oversight is required for evaluating anything an AI produces
When asked to read a chart, ChatGPT failed. But that didn’t stop it from answering with confidence. This is an example of an AI hallucination.
To see how far down the rabbit-hole ChatGPT would go, we asked it to explain why data was like fish.

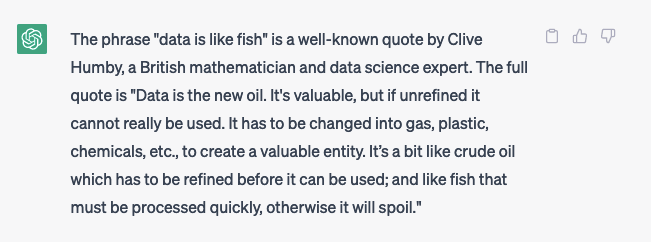
We could not find this quote on the internet anywhere. Although Clive Humby is credited with the phrase ‘Data is the new oil’, he was silent on the subject of fish.
We regenerated the response several times, and each time ChatGPT attributed the phrase ‘Data is like fish’ to a different person, namely:
- Danish physicist Niels Bohr
- Danish statistician and economist, Anders Hald
- US statistician W. Edwards Deming
None of these people have ever compared data to aquatic life.
ChatGPT writes confidently, whether it’s correct or not. It should be obvious by now that anything it says should be carefully fact-checked by a human before it’s used or published.
4. AI could automate away data drudge work
Caveats aside, AI has huge potential, not least to automate many low-level tasks. The clichéd statistic that 80% of an analyst’s time is spent cleaning data may not be literally true, but it’s undeniable that boring jobs like data cleaning and wrangling can take big chunks out of a project’s timeline.
Could data cleaning be fully automated? Maybe not. But AI is sure to speed everything up.
If a data analytics platform like Alteryx or Knime could accept natural language text prompts, tedious tasks like renaming columns or joining dataframes could be completed much faster, leaving you with more time to do the fun stuff, like compelling analysis and exciting visualisation.
Engineers could link ChatGPT to Tableau or PowerBI and submit text queries to generate data visualisations. The AI could write chart headlines, annotations and summaries that refresh themselves the moment the data is updated.
This future is not far away. Services like Expedia, Klarna and Wolfram are already rolling out ChatGPT plugins.
5. AI could make writing code much faster
The use of autocomplete has been around in Google searches for a long time now, and it has recently started to roll out in the emails we write and the texts we send. Now, AI is accelerating the process for writing code as well.
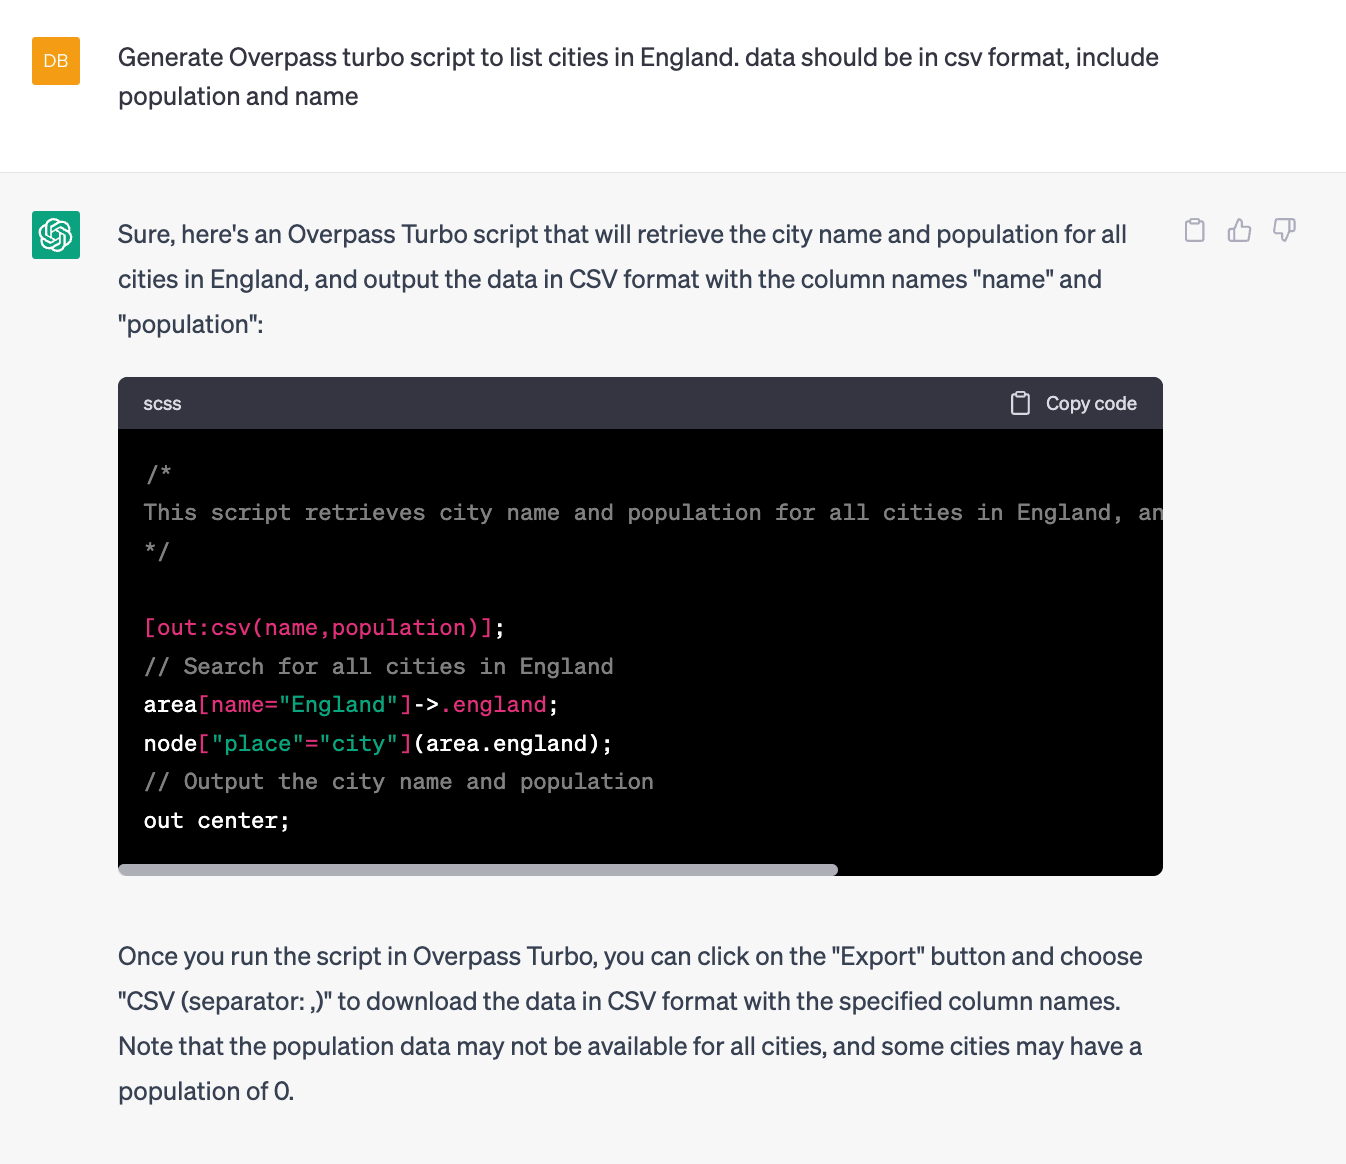
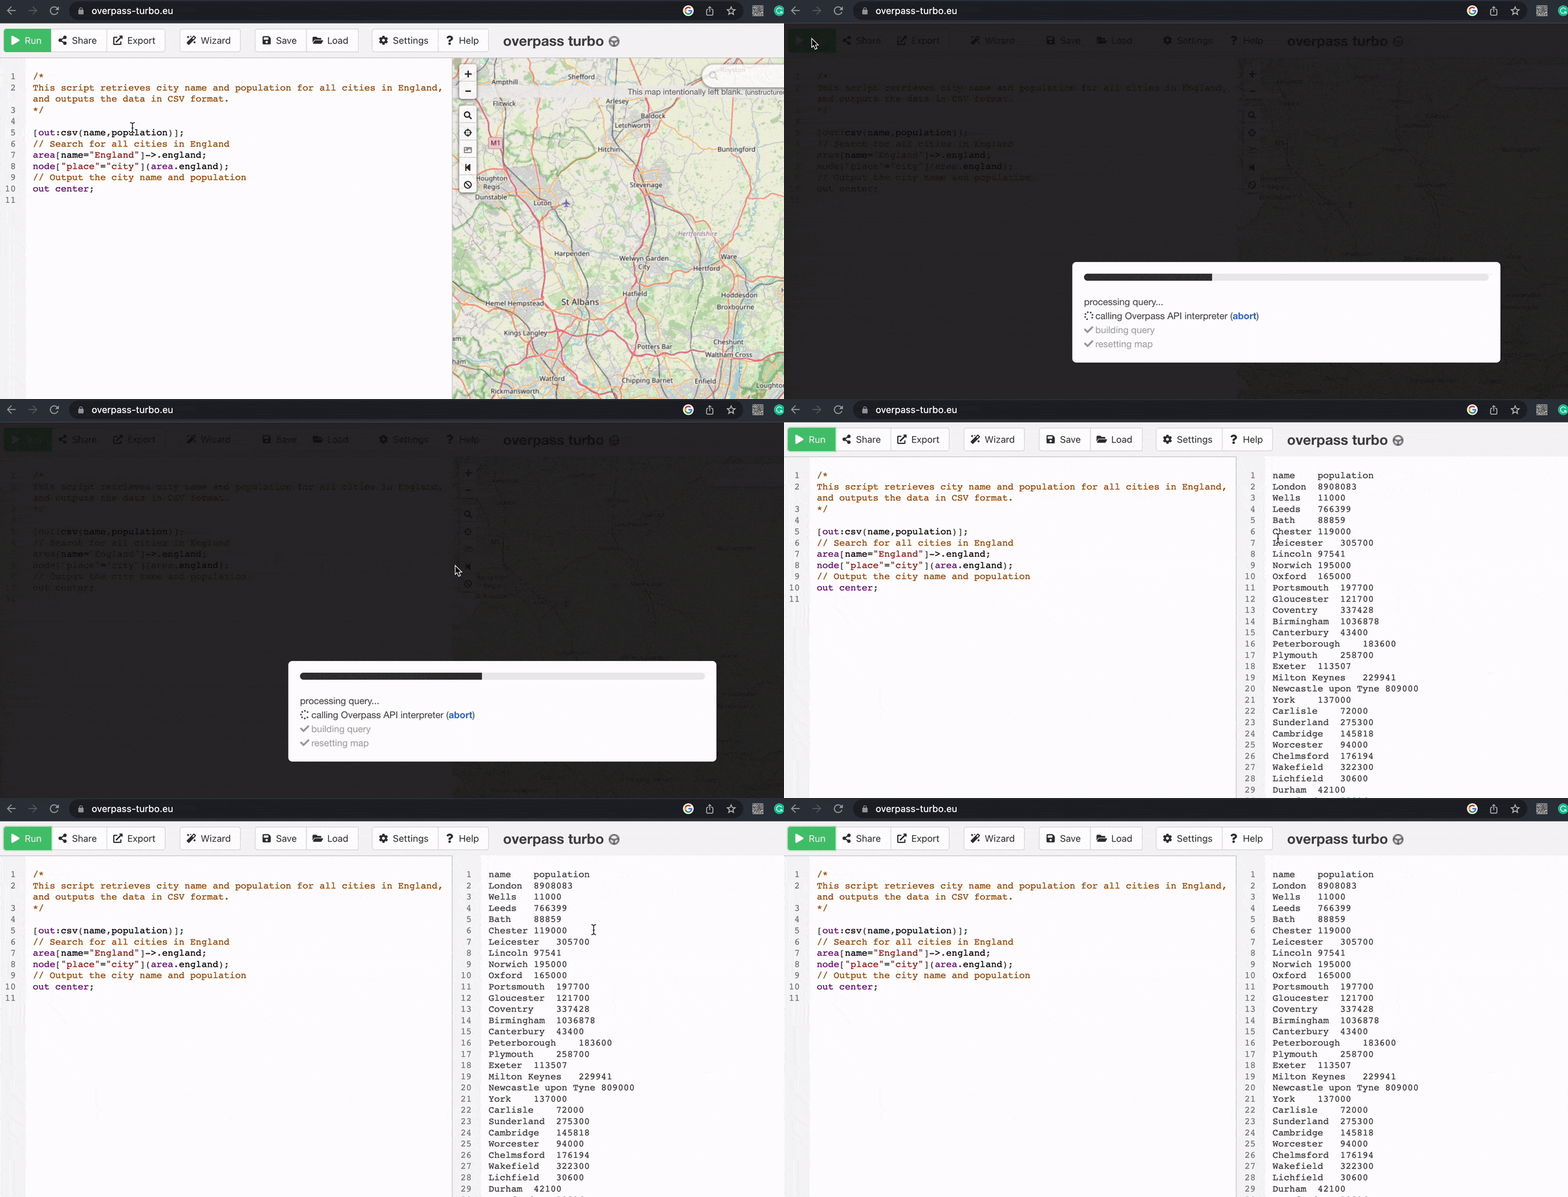
As an experiment, we used ChatGPT to query a database for some general information (in this case, cities in England by population size) from Overpass, which has a difficult syntax from a coding perspective.
And here’s what it came up with:
6. AI could revolutionise recruitment
Not just in the data sphere but in every sector.
Could AI be used as a more intelligent ‘blind’ screening tool within recruitment – not just scanning CVs, but asking questions based on the CV and the wider context of the role – to reduce biases. The danger here, of course, is that the AI simply reflects inherent biases present in the material on which it has been trained in the first place. Biased data in, biased data out.
There is, however, some evidence of good work being done already using ChatGPT. Check out the ‘Act as position Interviewer’ prompt in this GitHub repository of prompts, for example.
7. We should think about how to use AI best
In future, when it comes to leaning on these large language models, we should be careful of:
- Trusting it too much. It’s not always factually accurate. It can hallucinate.
- Over-reliance on AI to make key decisions (e.g. about recruitment) without human oversight. Here’s one example taken from the Guardian: “Mark Girouard, an employment lawyer in Minneapolis, found that the name Jared and having played lacrosse in high school were used as predictors of success in one system.” We can’t remove the human element of recruitment. As long as there are humans working in workplaces, we won’t want to.
- Amplifying biases around gender, ethnicity, age, class, etc. Instead, future versions could help reveal (rather than perpetuate) human biases. We should not rely on AI to ‘predict’ success, but use it to level the playing field for all.
Knowing what to type as the prompt is more than half the battle. In our experience, when designing information visualisations, you’ve got to have a certain level of expertise to even know what questions to ask, let alone what you want right from the get-go. Workshops are required to work this kind of thing out – with humans!
So, will an AI take my job?
Probably not in the near term. Probably supplement what you can do, not replace you.
But it’s all developing so fast…
These data automation experiments were run as part of FutureFridays, where we partner up with the brightest minds in data design to look at some of the world’s most pressing challenges. Get in touch if you have an experiment of your own in mind!
About Miriam

Miriam Quick is a data journalist, author and musician who explores novel and diverse ways of communicating data. Her first book, I am a book. I am a portal to the universe., co-authored with Stefanie Posavec, won the Royal Society’s Young People’s Book Prize 2021 and an Information is Beautiful Award 2022.
