 Insight
Scanning the data horizon — How new technology can unlock data storytelling

A number of new and emerging technologies may have a lasting effect on data storytelling. Most of this new tech is dominated by AI tools, including MidJourney, DALL-E (and other text-to-image solutions) and (of course) GPT-3 (better known as ChatGPT).
Good progress seems to be being made in the AR & VR space as well, which might have a significant impact on data storytelling and its transformation over the coming years.
It’s also important not to overlook progress in existing and more traditional tech, like WebSocket and WebRTC, as well as tools that reduce time spent on development while still delivering the same – or even improved – results.
Let’s dive into these areas of advancement and look at some example use cases of data storytelling powered by the latest wave of tech.
GPT-3 (ChatGPT) for automating data tasks
OK, everyone knows about ChatGPT by now. But while almost 99% of users are looking to increase personal productivity, the tool can also be utilised for certain automation tasks on the web.
When it comes to data storytelling, we can’t skip the data analysis step. But sometimes the data is very unstructured, and other times it is hard to structure it using standardised tools.
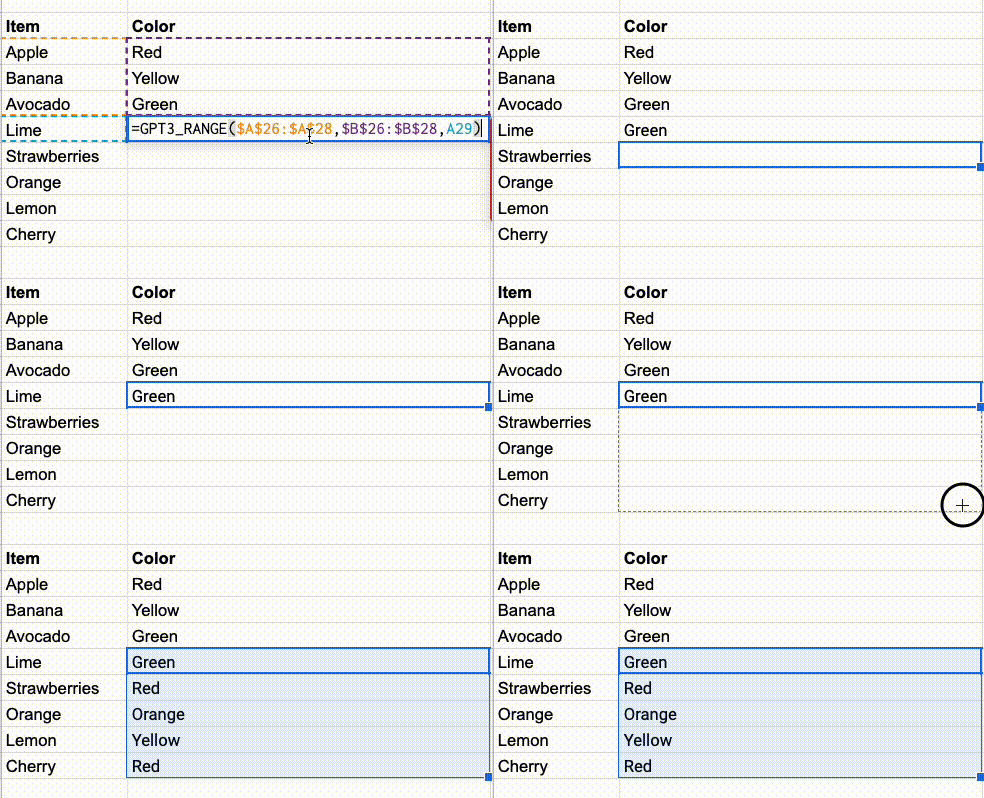
For example, how would you write a spreadsheet formula that can calculate the colour of different fruits? We can’t do that in a standard way.
But we can do it by utilising GPT-3 APIs:

This is just one use case, but we could incorporate this capability into many projects.
Looking at resumé or CV editors, for example, instead of prompting users with annoying HTML forms to understand more about them and offer customised results, we could utilise GPT-3 and extract structured data (like salary, experience and education) with significant levels of confidence. This would allow us to offer even more customised solutions to those users, which is not easily achievable using standard tools.
Text-to-image AI for data dashboard design
While significant progress has been made, text-to-image solutions like MidJourney and DALL-E still have a long way to go before they are able to produce results, which in theory could revolutionise the design space and save designers so much time. That said, some ethical questions remain around training data that must be answered first.
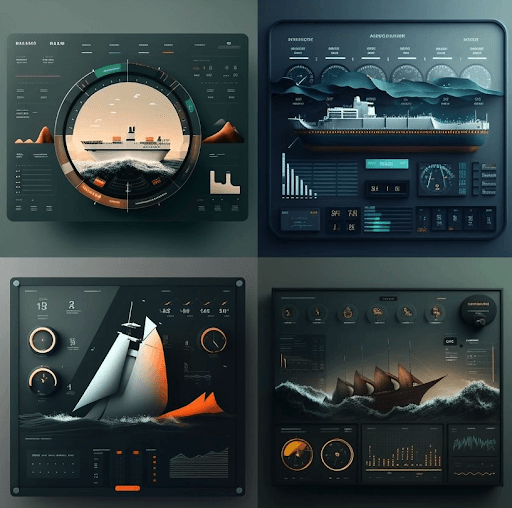
Nonetheless, even now, these AI-backed tools are able to produce stunningly beautiful data dashboards, offering up their own use cases to those working to create visual data that really draws the viewer in.
For example, if we ask these tools to ‘generate a dashboard that includes a ship, waves and KPI dials’, we end up with something like the following in a matter of seconds:

AR & VR for storytelling (beyond gaming)
Top tech companies like Apple (Reality Pro), Meta (Metaverse), Microsoft (HoloLens) and Google are all trying to be the trailblazers in the next big tech revolution, which many believe will see us switching between AR and VR spaces.
At this point, the use of AR & VR is pretty much limited to gaming. Wider use in industries like education, health, sport and retail remain somewhat limited at this stage.
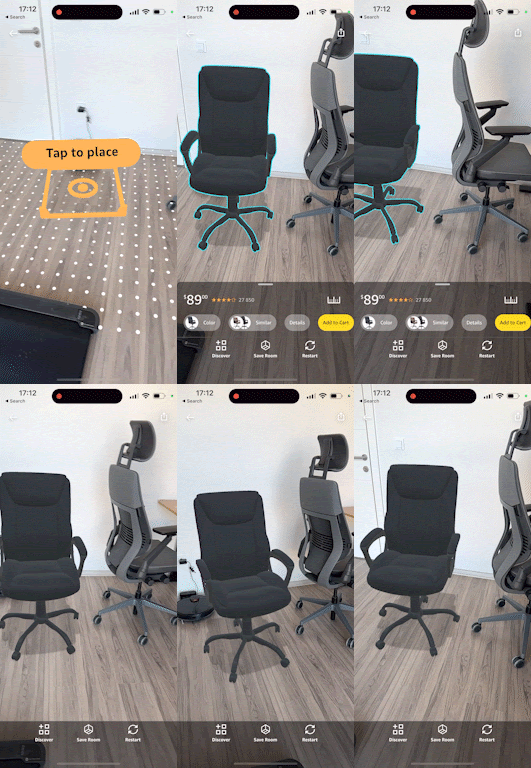
However, Amazon already utilises AR & VR in their app: we can preview objects in our own space, which is especially helpful when we want to order something online and are not sure how it will look once it’s in place.

This tech has the potential to really transform the data storytelling space. For example, instead of a web-based solution, we could leverage augmented reality to tell data stories where the user experiences the story in their present environment. Imagine being able to experience a star constellation data story in a 3D space, wherever you are at that moment in time.
This part of the tech revolution isn’t here yet, but it will be exciting to see how it develops.
WebRTC and Websocket for boosting user interactivity
Although this sounds very technical, Websocket and WebRTC are emerging technologies that first made it possible to switch from Skype to web-based meeting tools like Google Meet.
These technologies give us advanced parallel editing possibilities, like the ones we have in Figma, Google Docs, Google Sheets, and so on.
Crucially, these technologies are underutilised when it comes to data storytelling.
Imagine a platform with a compellingly designed and highly interactive tool, accompanied by custom-tailored graphics, which is able to interact not only with one user but also with multiple users at once. This concept is very powerful, and it’s a strong step towards the success of any product that’s trying to solve something. As one example, AWS would certainly benefit from this kind of platform.
Apart from multiple user interactions, WebSockets make it easy to integrate real-time graphics in data storytelling, which is another significant feature in multiple sectors (primarily in the IOT space).
Consider a live map of cyberthreats. Many cybersecurity companies have some kind of map that displays existing threats on the global scale, but not many of them offer a live map presenting up-to-the-millisecond information, tracking every cyber attack worldwide in real time. Websockets offer the necessary tools to make it easier to implement these kinds of live maps and the level of precision required by users.
At infogr8, we join the dots between emerging tech and data storytelling
With access to a global network of data specialists, infogr8 can build a tailor-made team for any data-led project. From thinkers to makers, we provide specialists for any phase of your data projects, including discovery, design, development, testing and deployment. And each team member is passionate about the work we do and the tech we use to bring your data to life.
Here are a couple of ways we can get you started:
- Run a Lunch & Learn event for your team or organisation
- Join in one of our FutureFridays design sprints
Or reach out to us to find out more about our unique approach to data storytelling.
