Show me people's
compared with their
Colour by:
Show results from:
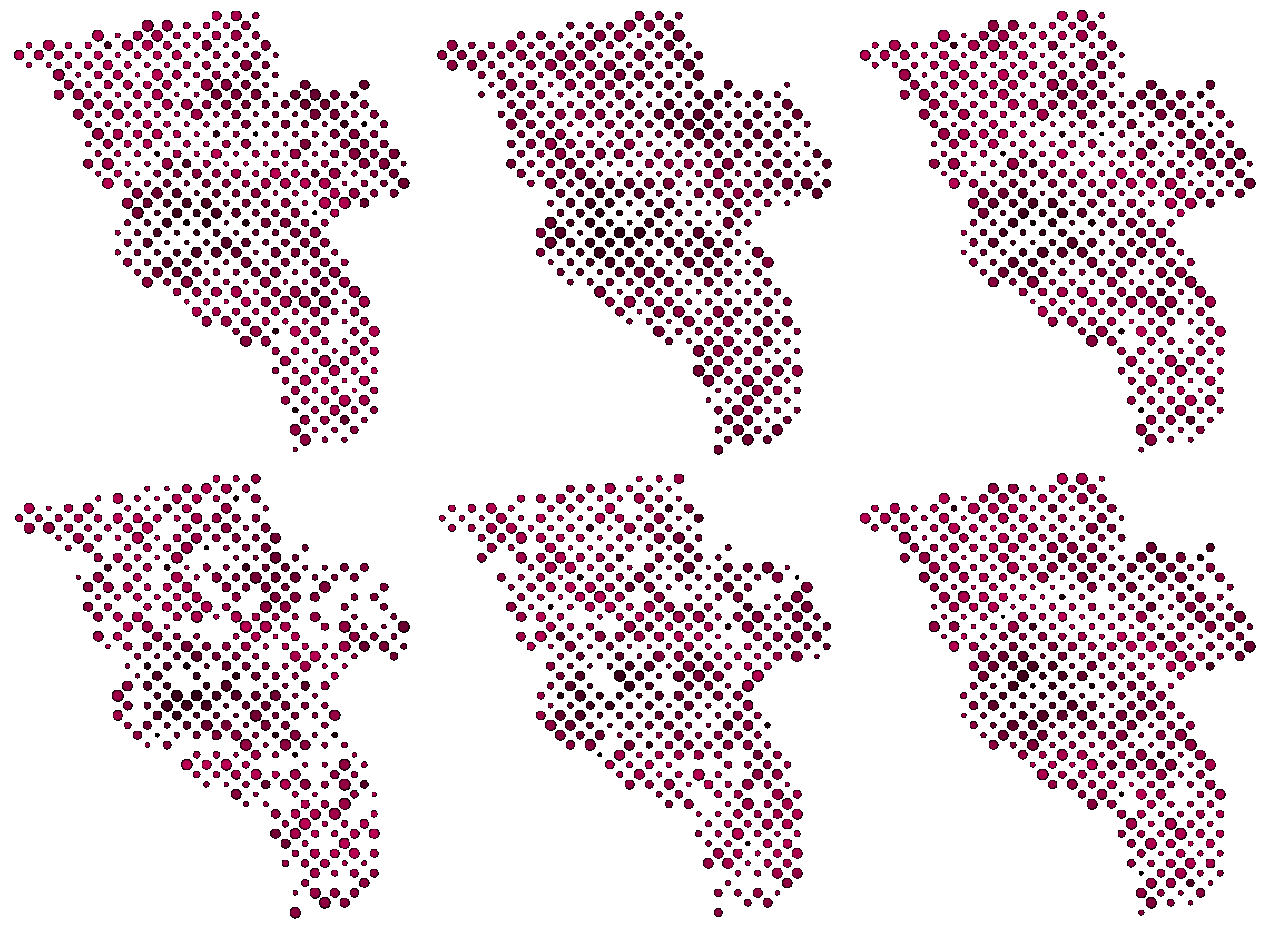
In partnership with Clerkenwell Design Week, infogr8 created an interactive data visualisation to reveal the design patterns, inspiration and trends of the community it was born in.
We use data as a way to demystify the world around us. It’s a lens through which new insights can emerge. And as Clerkenwell Design Week inspiration changes and evolves throughout the week, so will the tool, showing new patterns as data is added and showing how our inspiring community of designers, architects and artists connect.
You can become part of the story by answering 5 simple questions, or explore the data for yourself.

Show me people's
compared with their
Colour by:
Show results from: