Campaign ESPN - End of the Road
Challenge
infogr8 set out to create an original, meaningful and explorative data visualisation worthy of standing alongside other award nominated pieces for 2015.

Solution
As avid racing fans, we sifted through piles of open datasets to learn more about the history of the sport.
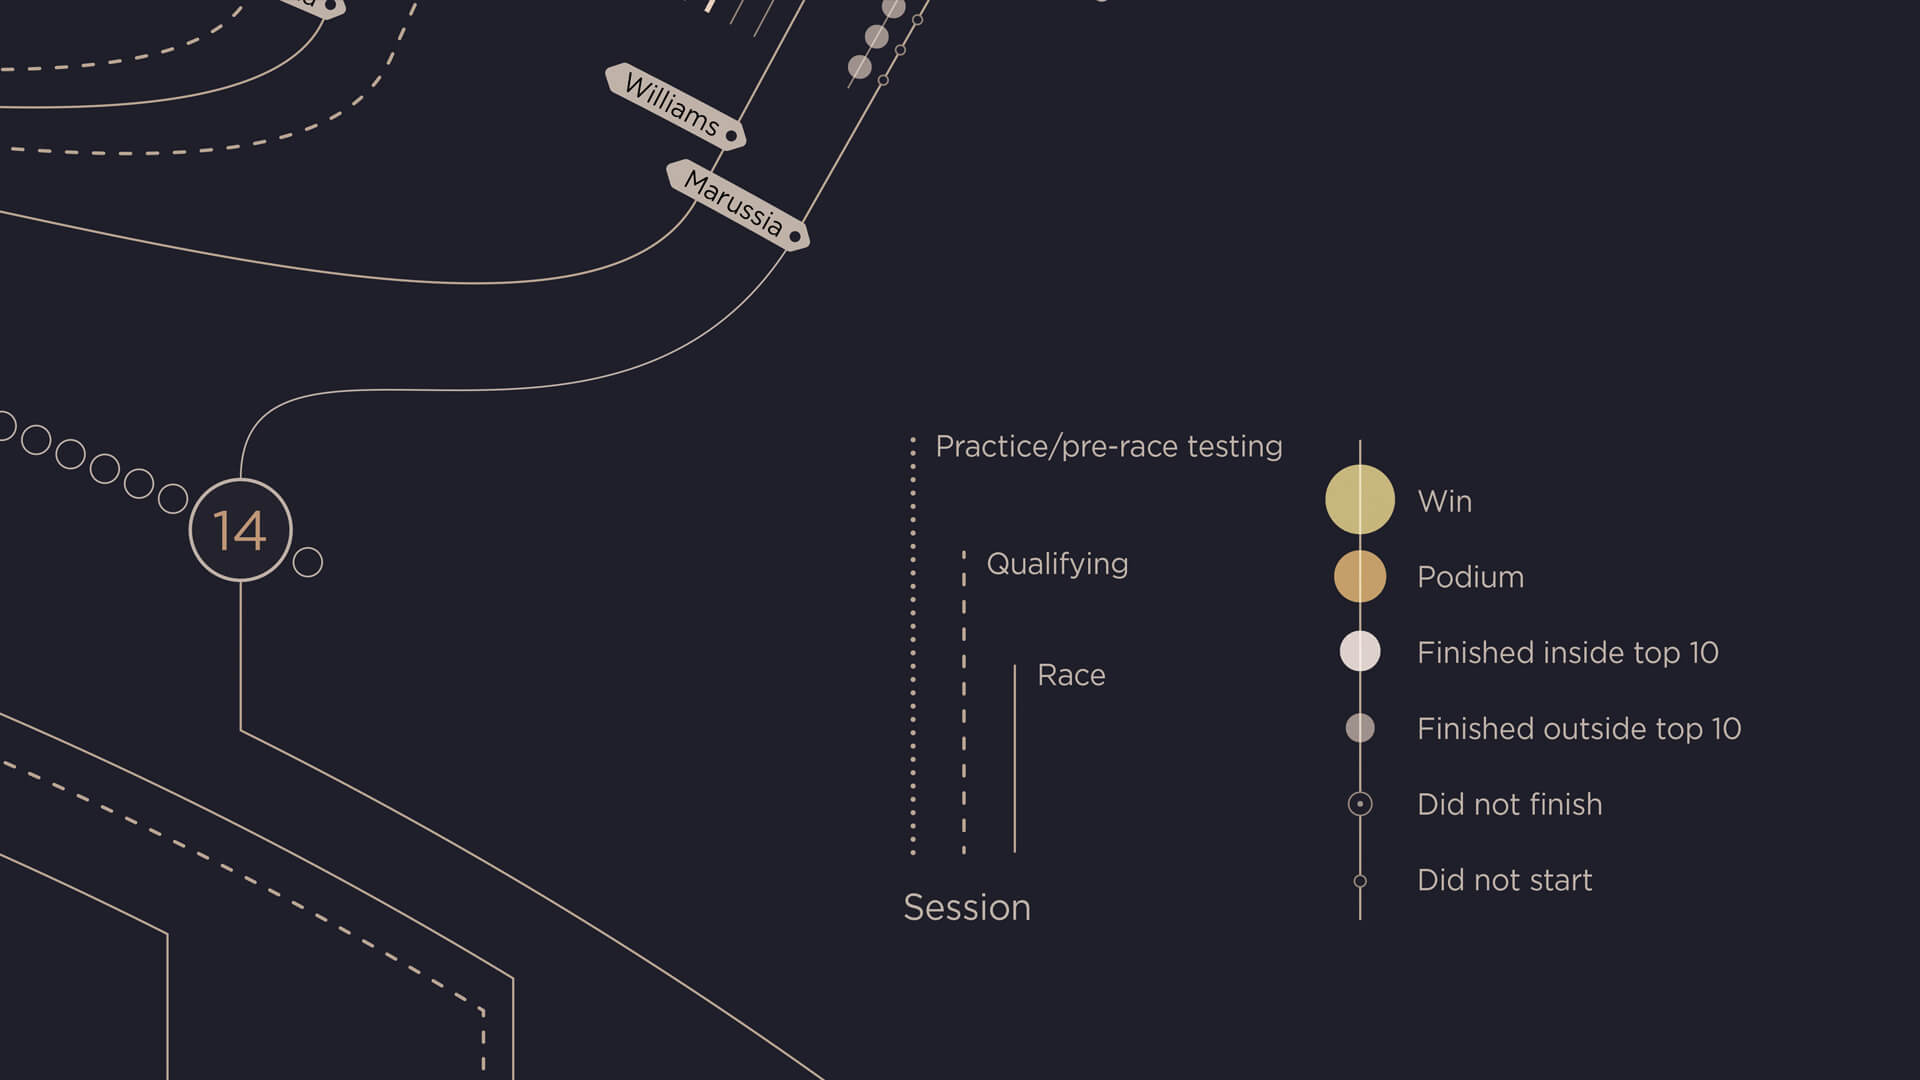
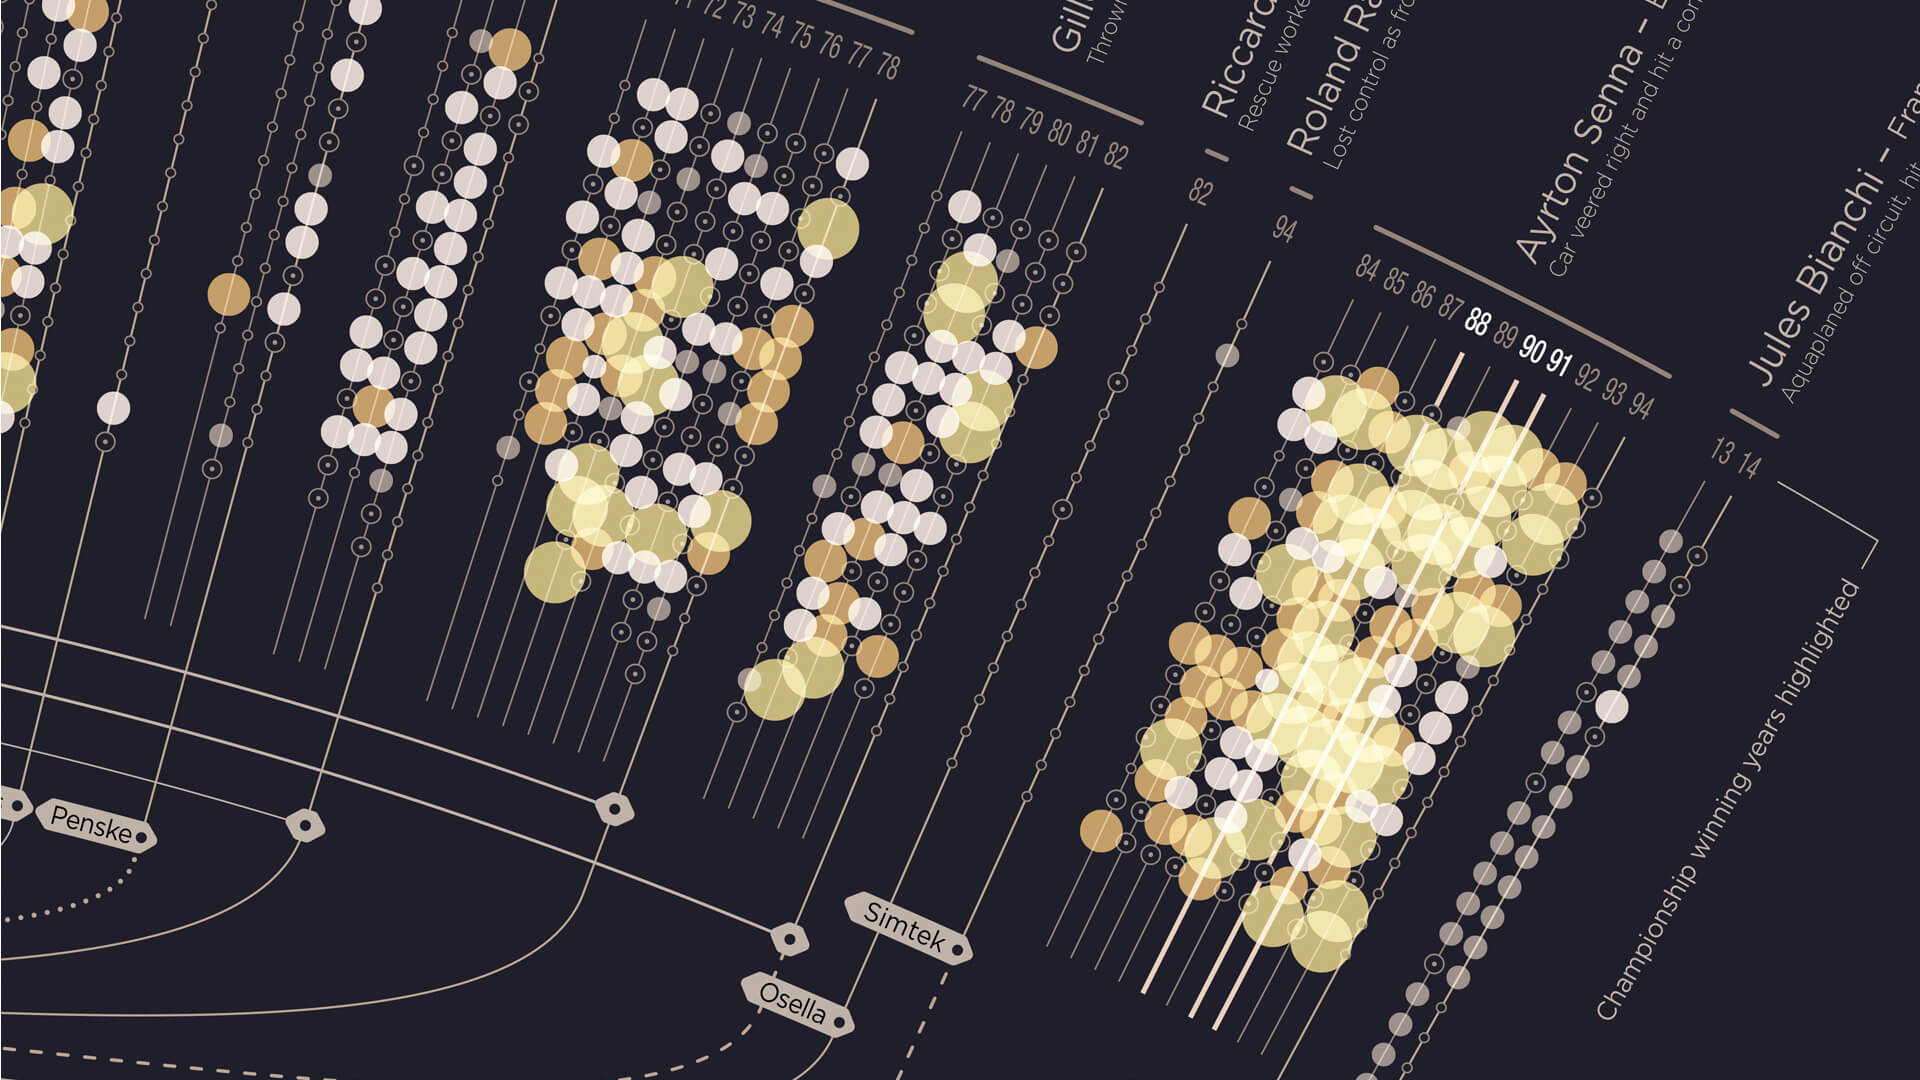
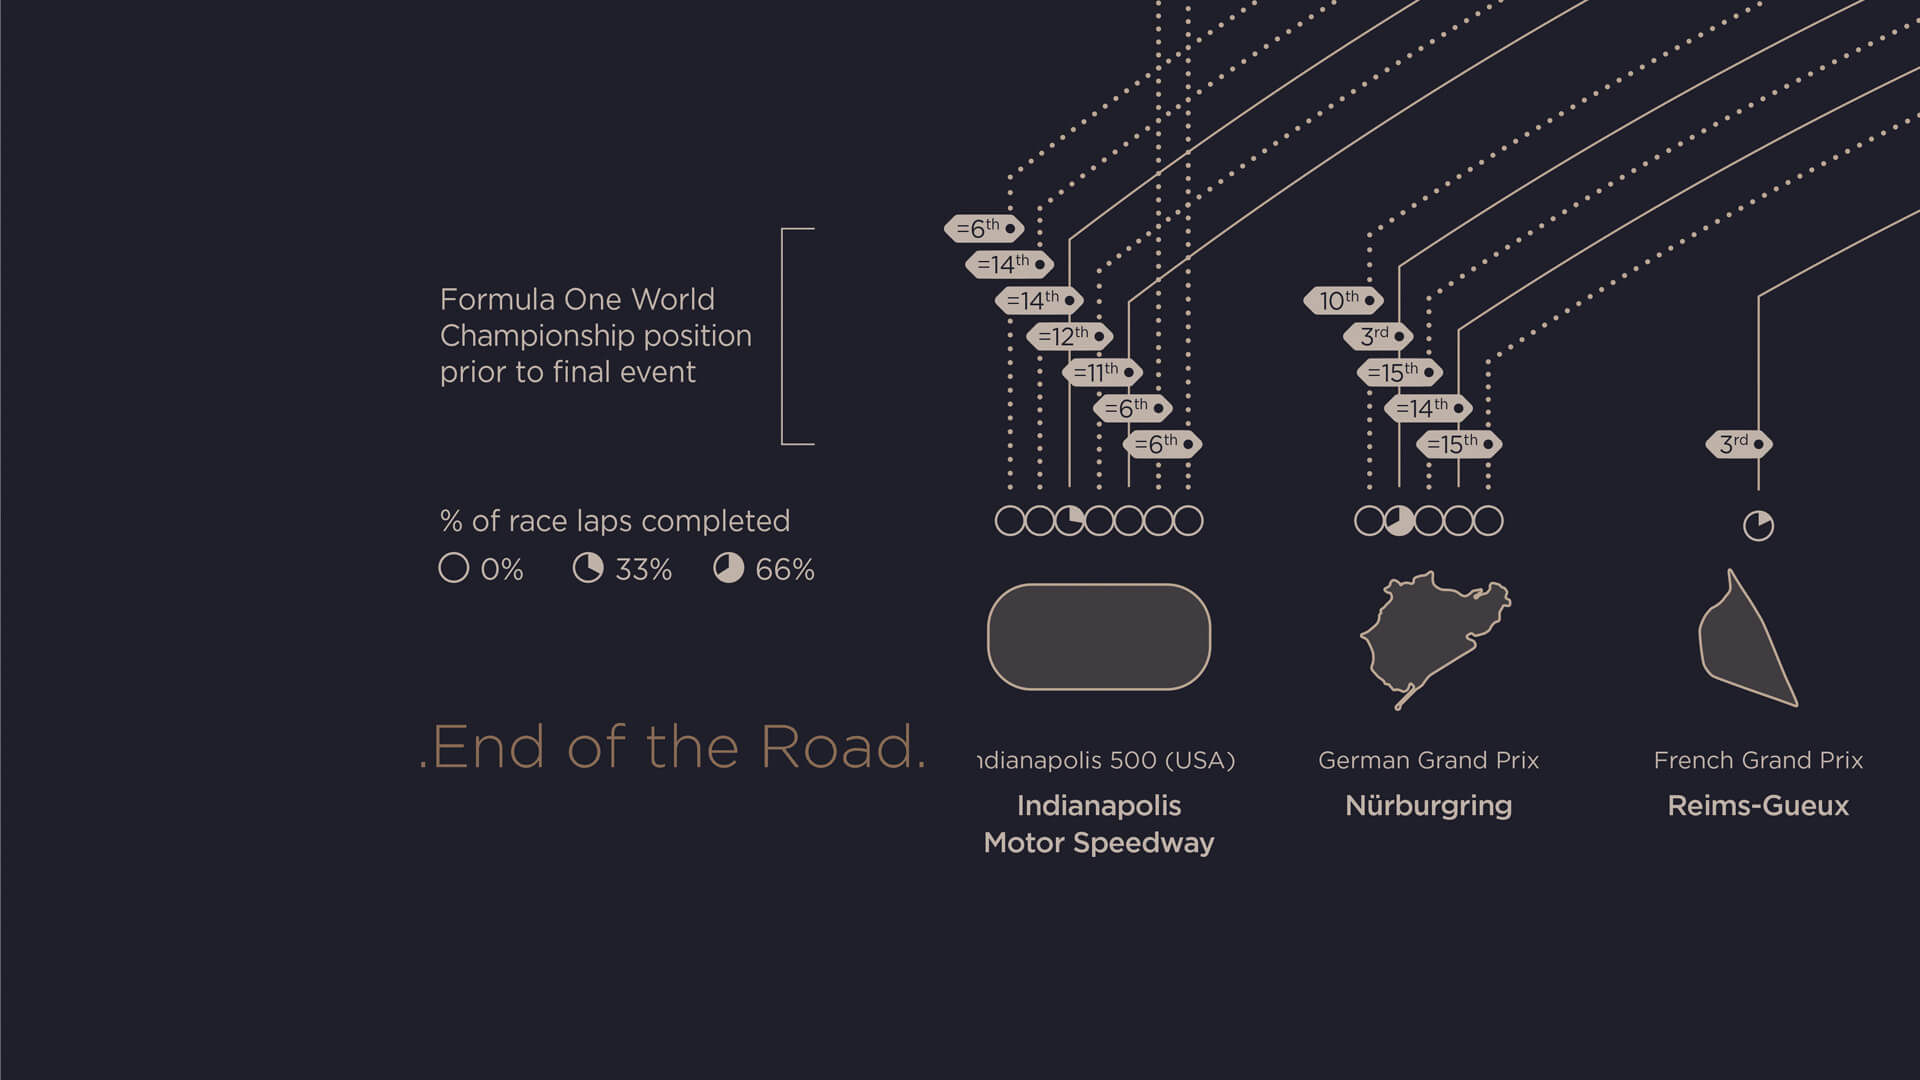
By visualising driver career achievements, team, championship position and race circuits, we were able to shape some intriguing stories across a rich data visualisation landscape. The visual shaping and colour aesthetics were carefully crafted to subtly symbolise a racing drivers dashboard whilst allowing a reader to absorb a dense amount of information quickly. The final output has been developed as a wall piece, one that is appreciated and admired on infogr8’s studio walls today.
Results
Published by ESPN.
Data for Everyone®
- Telephone
- +44(0) 207 193 9594
- Address
Soho Works White City,
Television Centre,
101 Wood Lane,
London,
W12 7FR
- [email protected]
Newsletter
Talent
We are always looking for great people to join our growing network of Global data experts.